80 Strategies. All Lost Money. They Had One Thing in Common.
 Ryan Bajollari
We generated 1,000 trading strategies and backtested every one against 30 days of Kalshi's 15-minute BTC markets. Here's what won, what lost, and the patterns behind both.
Not investment advice. Educational content only. Results are from a backtest, not live trading. Full disclaimer at the end.
Over the weekend we generated 1,000 distinct trading strategies, fed them into Turbine's backtest engine, and ran every one of them against Kalshi's 15-minute BTC market series (KXBTC15M) over the last 30 days. Each strategy executes across roughly 2,900 individual markets in the window. That is 2.9 million simulated strategy-market pairings.
Here is what the numbers say, and how we would use them if we were trading these books tomorrow.
The Headline
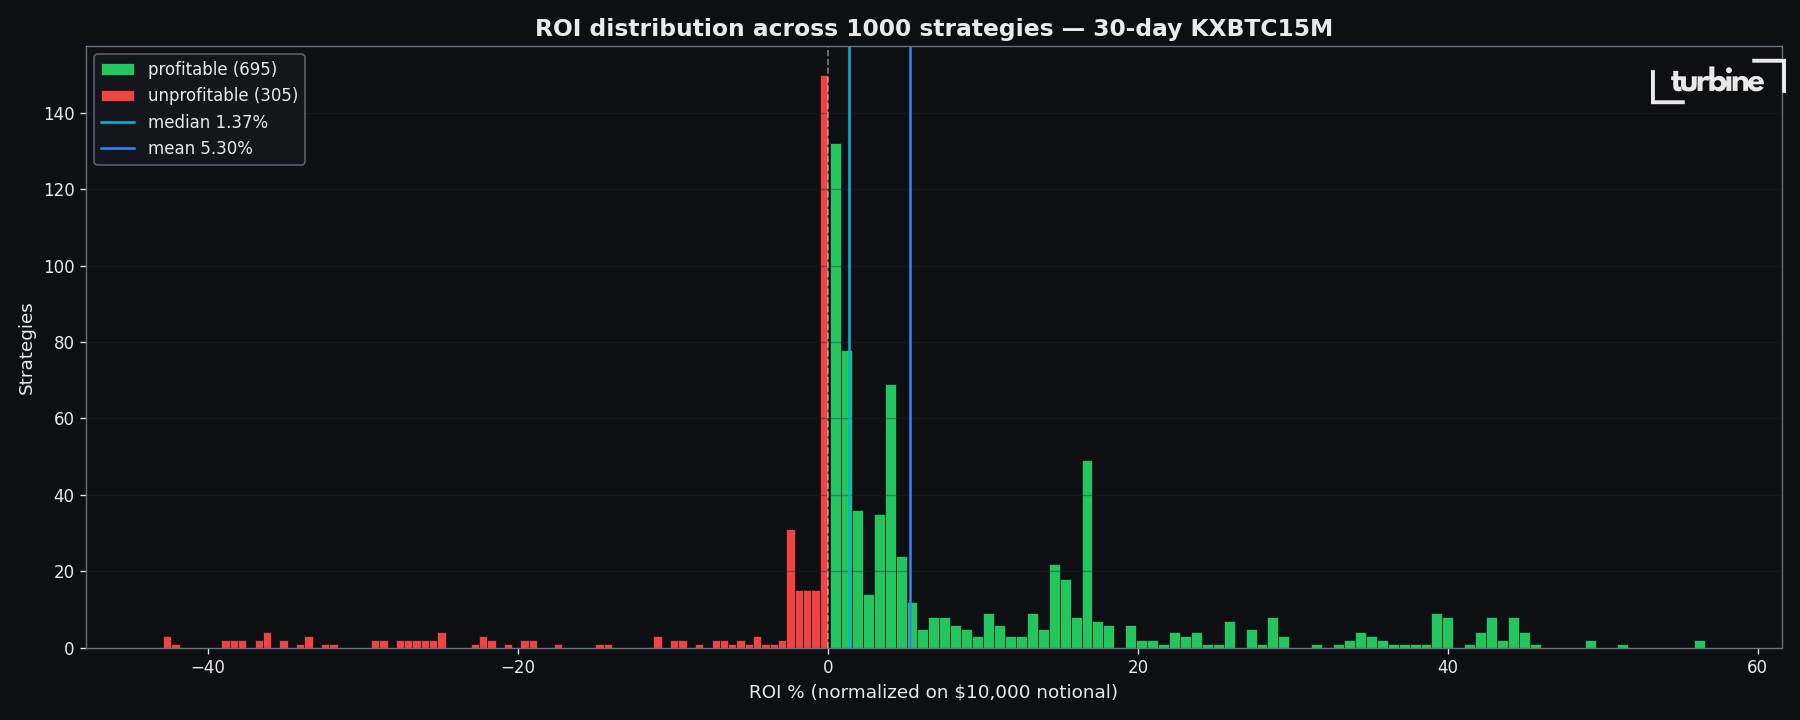
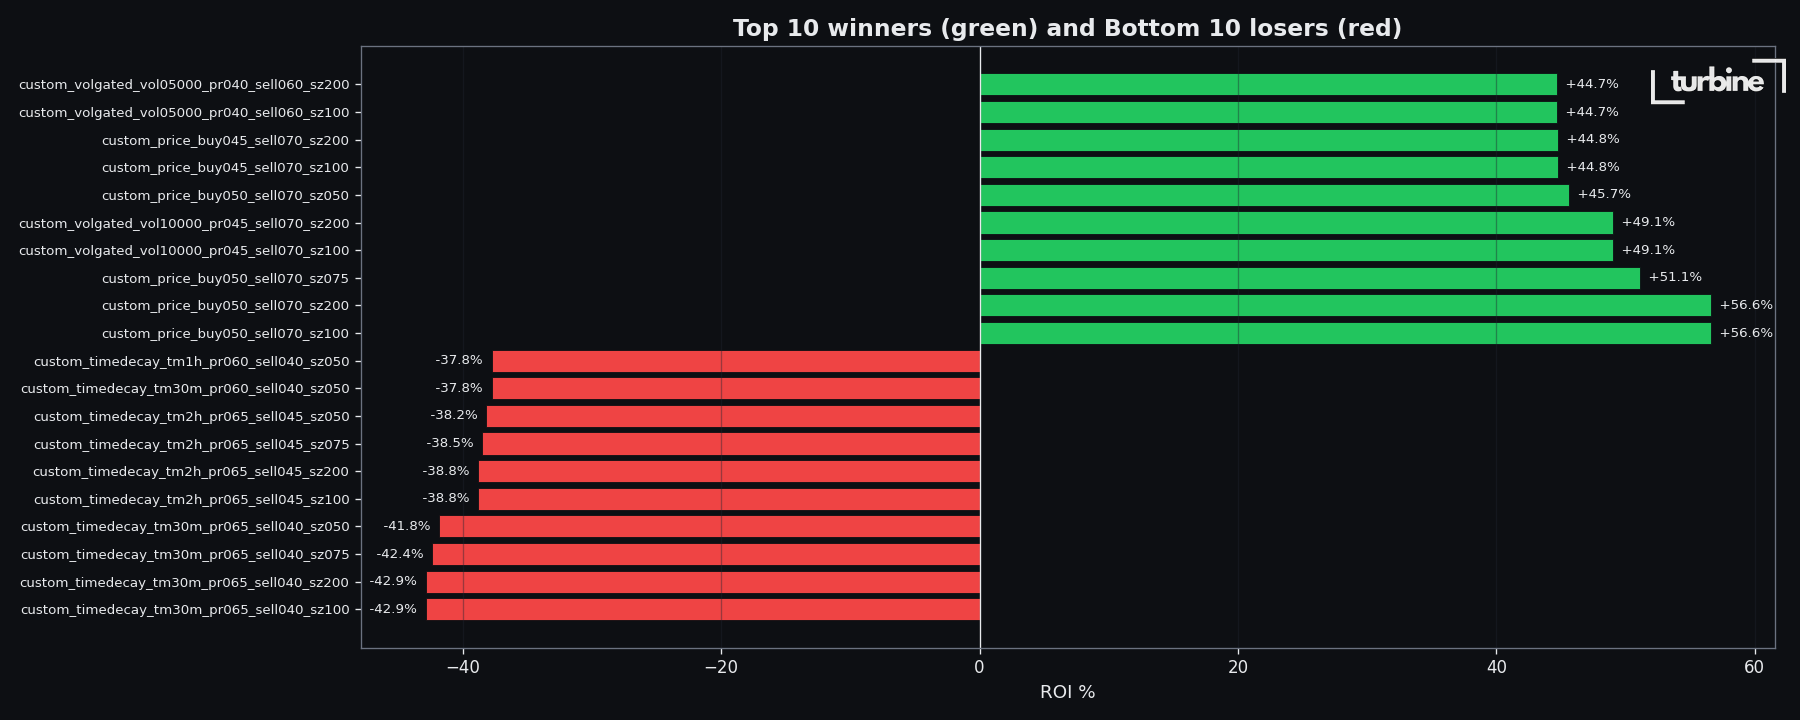
Out of 1,000 strategies, 695 made money. 305 did not. Median ROI was +1.37% on a $10,000 notional. The best strategy returned +56.6%. The worst returned -42.9%.
The distribution is heavy-tailed on both sides. Most strategies cluster near zero. A few make real money. The losers lose hard.
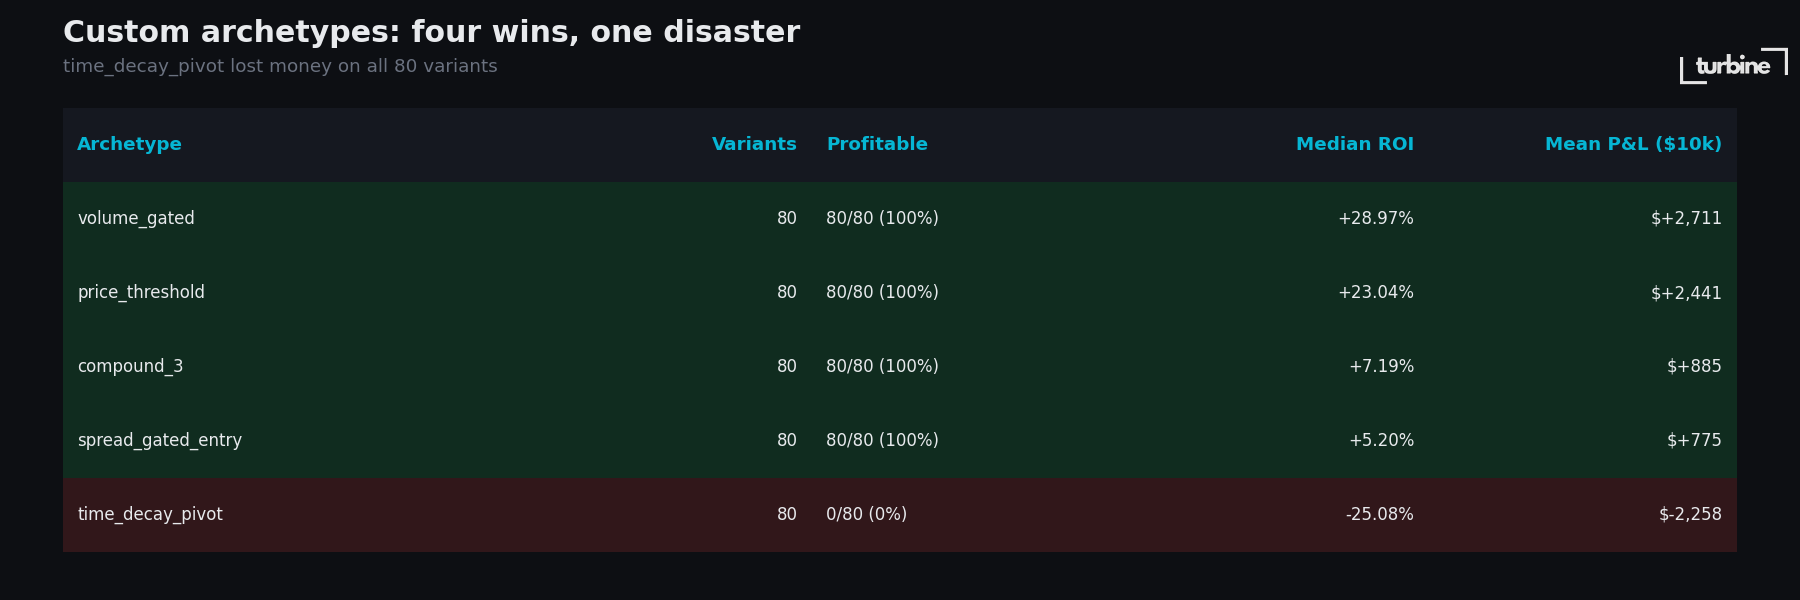
The Zero-for-80 Loser
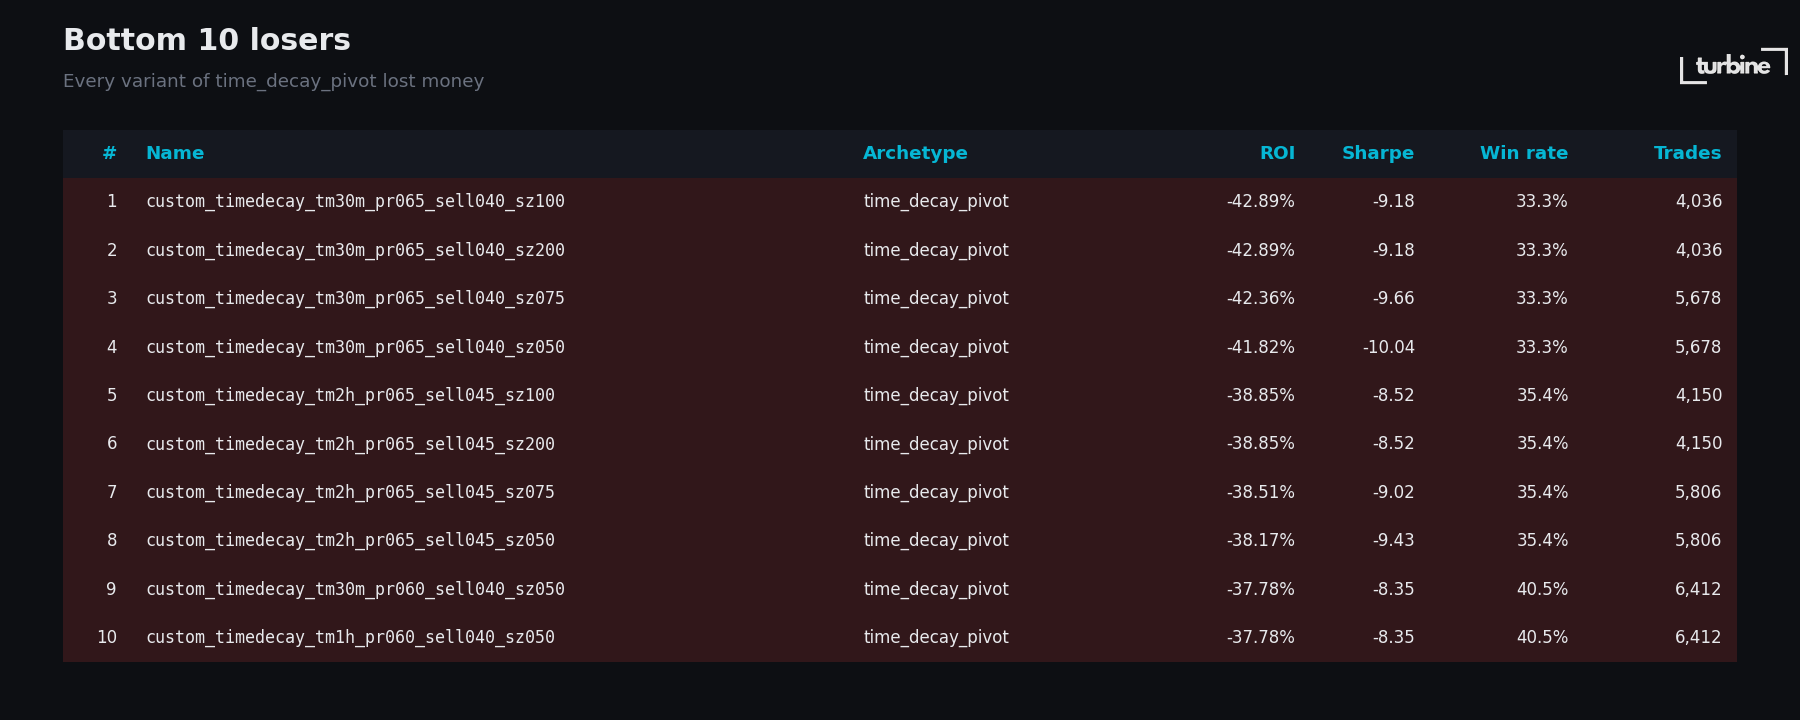
The first finding floored us. We built a custom archetype called time_decay_pivot: buy NO in the final 30 minutes to 2 hours of a market's life if price is already above 0.60 to 0.70. The logic seemed reasonable. Markets that have run up should mean-revert. Surely some parameterization of that idea would work.
Zero of 80 variants made money. Not a single one. Mean loss: -$2,258 per strategy. Every threshold combination, every size, every time window, all underwater. Sharpe ratios of -7 to -10 across the board.
On 15-minute BTC markets, once a book is above 0.60 with an hour left, it is not reverting. The post-move drift is real and it is in the direction the market is already heading. Fighting that drift is not a strategy. It is a subscription to losses.
The 150-for-150 Winner
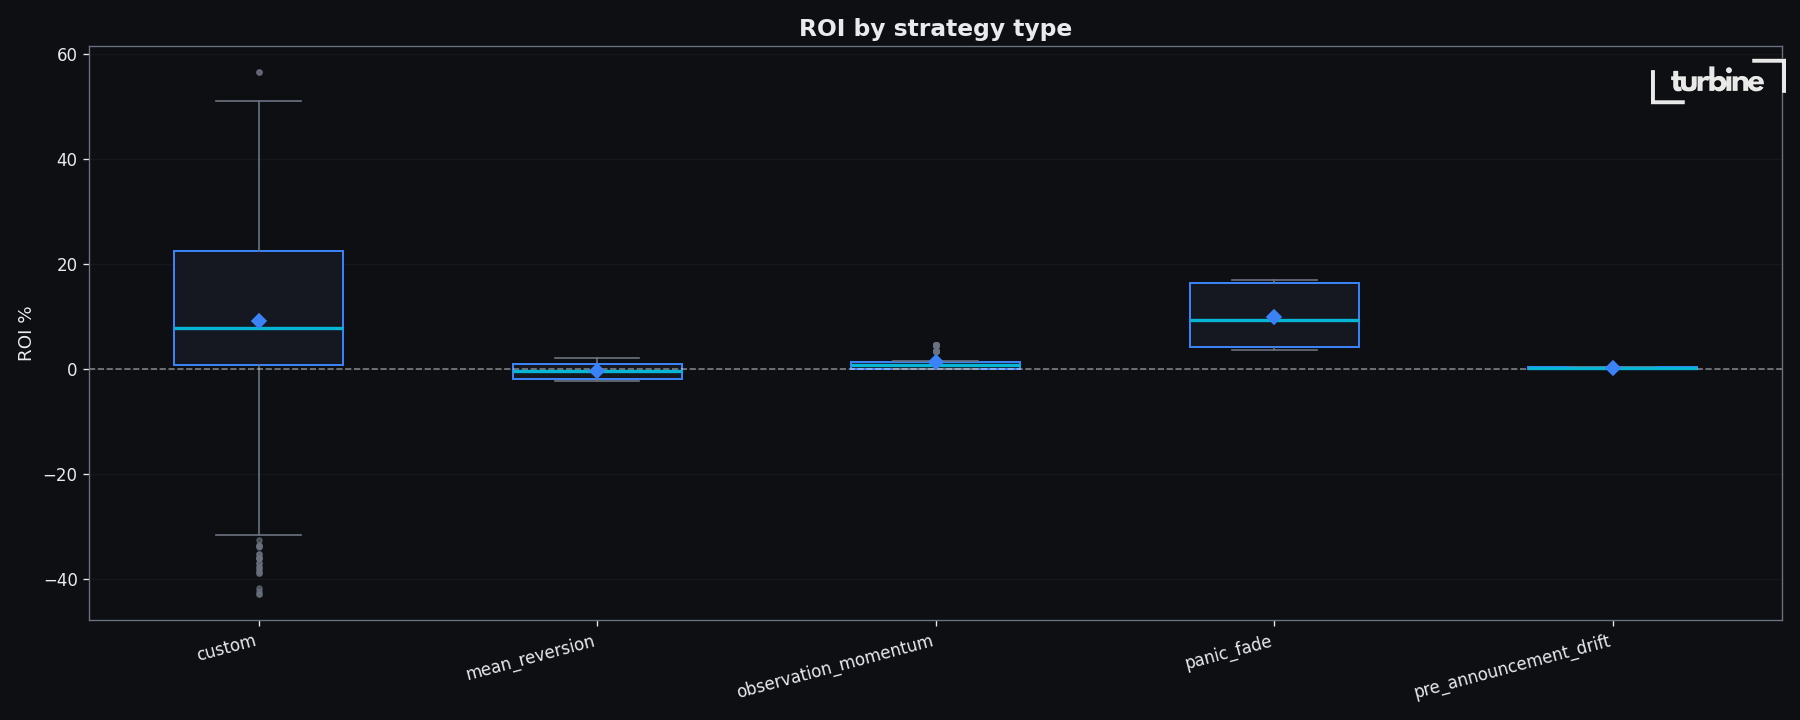
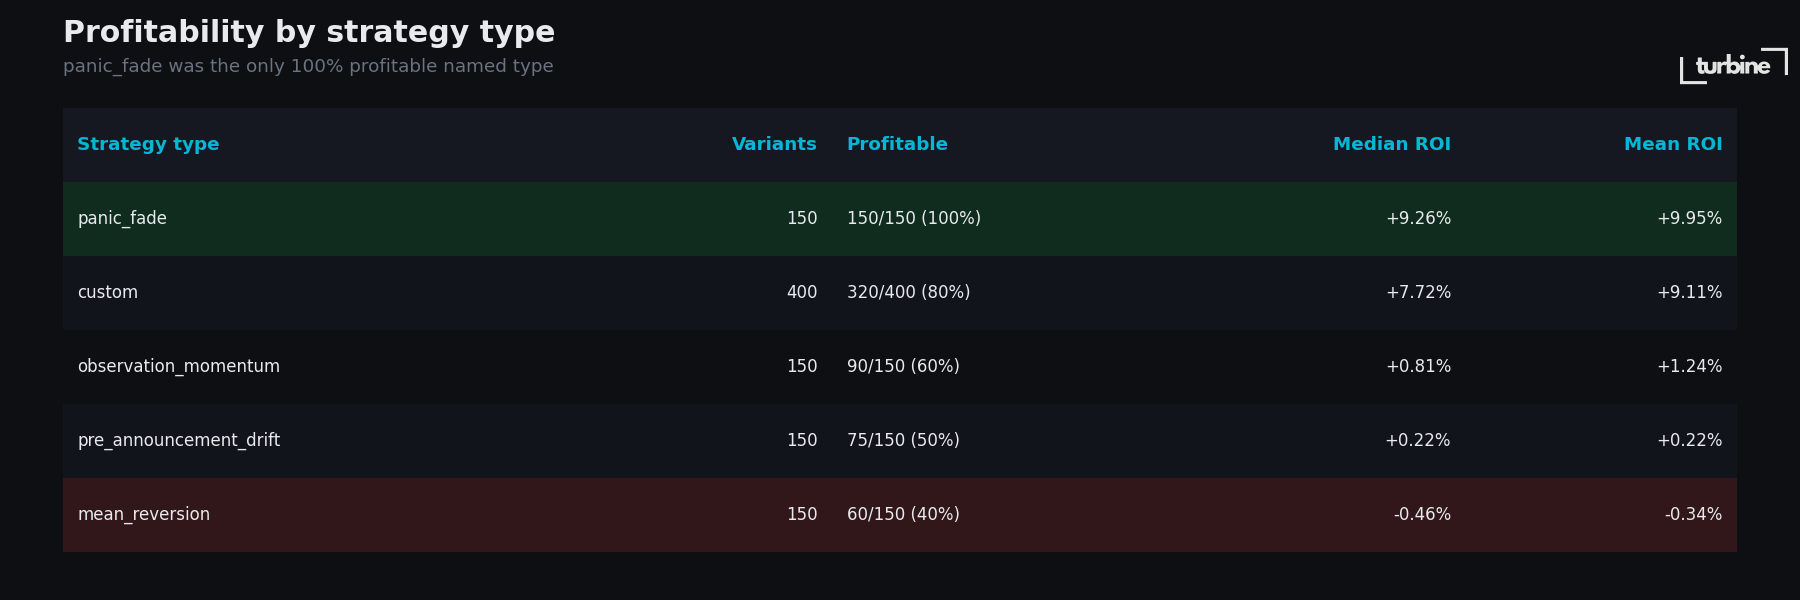
The inverse surprise was almost as clean. panic_fade, fade the extreme move, lean against short-term momentum, was profitable on all 150 variants we tested. Mean ROI +9.95%. Best clusters were panic_threshold of 0.03 to 0.10 paired with any fade_size.
For 15-min BTC, volatility-reversion is the most reliable edge. Every way we parameterized it, it worked.
The Top 10 Were All the Same Idea
Look at the leaderboard:
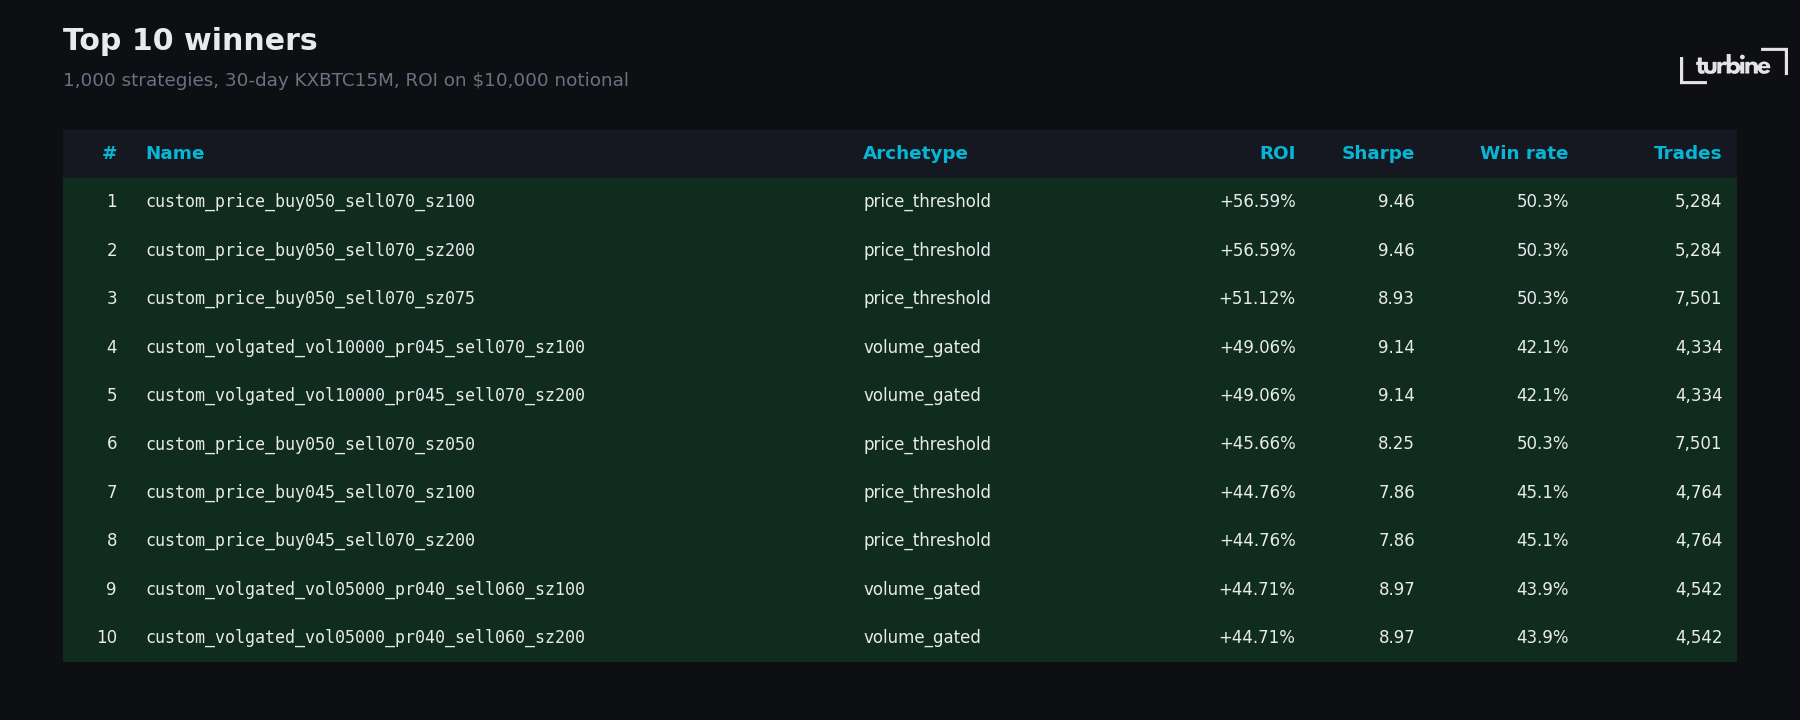
Every single one is a variant of "buy YES when the market is cheap, sell when it comes back." The winner was custom_price_buy050_sell070: buy when price dips to 0.50, sell at 0.70. +56.6% over 30 days on a $10k notional, 5,284 trades, Sharpe 9.46.
Volume-gating, spread-gating, compound 3-predicate rules, all basically tied the simple price_threshold at the same thresholds. Adding conditions did not improve returns. It just filtered more trades.
Takeaway: on thin 15-min books, the simplest strategy that works is the one that works best. Stop over-engineering.
The Mean-Reversion Trap
mean_reversion was the worst named strategy type. Only 40% of its 150 variants were profitable. Mean ROI -0.34%. Narrow entry bands (entry_low 0.15 to 0.25) never triggered. Wider ones triggered on the wrong side of trending markets.
This is a strategy template that works beautifully on long-duration two-way books (NFL point spreads, election markets that sit open for months). It does not work on 15-minute crypto brackets. Market duration eats the template alive.
The Bottom Line
- On KXBTC15M, buy YES cheap and sell on recovery. All day.
- Fade the panic. The book loves to reprice.
- Do not buy NO late. You are fighting drift.
- Complexity does not pay. The simplest price_threshold variants were top-of-leaderboard.
- Size matters. 7 of the top 10 used size=100 or higher.
How We Ran It
All 1,000 strategies were generated deterministically, submitted to the production Turbine backtest API, and committed to our strategies library. You can browse them today in the Turbine Studio strategies tab under crypto. Total generation + backtest time: about 90 minutes end-to-end on a weekend.
If you want to run your own version of this, swap the series, change the window, try different archetypes, Turbine Studio lets you do it without writing code. Describe the strategy in plain English; we compile it to DSL, run the backtest, and give you the results in a spreadsheet-ready format.
We will keep doing these. Next run: ETH 15-min, same shape, and a handful of your strategy ideas. Reply with one and we will add it to the batch.
Follow @turbinefi for the next drop.
Caveats
One window (30 days, ending 2026-04-20), one series (KXBTC15M). Different window or series would produce a different leaderboard. Treat the shape of the findings as more robust than any individual rank.
ROI is normalized on a $10,000 notional because backtest equity curves are easier to compare that way. Relative ordering is accurate; read the percentages as "P&L per $10k deployed."
Backtests use historical Kalshi market data and a simplified execution model. Live execution hits deeper orderbook slippage, venue hiccups, and liquidity that moves under you. Past performance, hypothetical or real, does not predict future performance.
Disclaimer
This post is for informational and educational purposes only. It is not investment advice, a recommendation to trade, or a solicitation to buy or sell any financial product, contract, or instrument. Turbine is not a registered investment adviser, broker-dealer, commodity trading advisor, or commodity pool operator.
The results described are from a backtest: a simulation of how strategies would have performed against historical Kalshi market data over a specific 30-day window on a single market series (Kalshi's KXBTC15M). Kalshi contracts are regulated by the U.S. Commodity Futures Trading Commission.
Hypothetical and simulated performance results have inherent limitations. They are prepared with the benefit of hindsight, do not involve real capital at risk, and cannot fully account for the impact of execution, liquidity, fees, or changes in market conditions. No representation is being made that any strategy will or is likely to achieve profits or losses similar to those shown.
Past performance, whether actual or hypothetical, is not indicative of future results. Trading prediction-market contracts involves substantial risk, including the possible loss of the entire amount invested.
Strategies described here were built and backtested by the author for research. Turbine does not recommend any of these strategies for use.
You are solely responsible for any decisions you make. Before trading any product, consider your financial situation and risk tolerance, and consult a qualified professional. Do not rely on anything in this post as the basis for a trading decision.