We Backtested 500 Weather-Market Strategies. The Best Signal Was Not the Most Complicated One.
Not investment advice. Educational content only. Results are from a backtest, not live trading. Full disclaimer at the end.
We ran 500 strategies against Kalshi's New York high-temperature market, using National Weather Service data from LaGuardia as the weather feed.
Ten strategy families. Fifty variants each. Same market, same date range, same basic execution model.
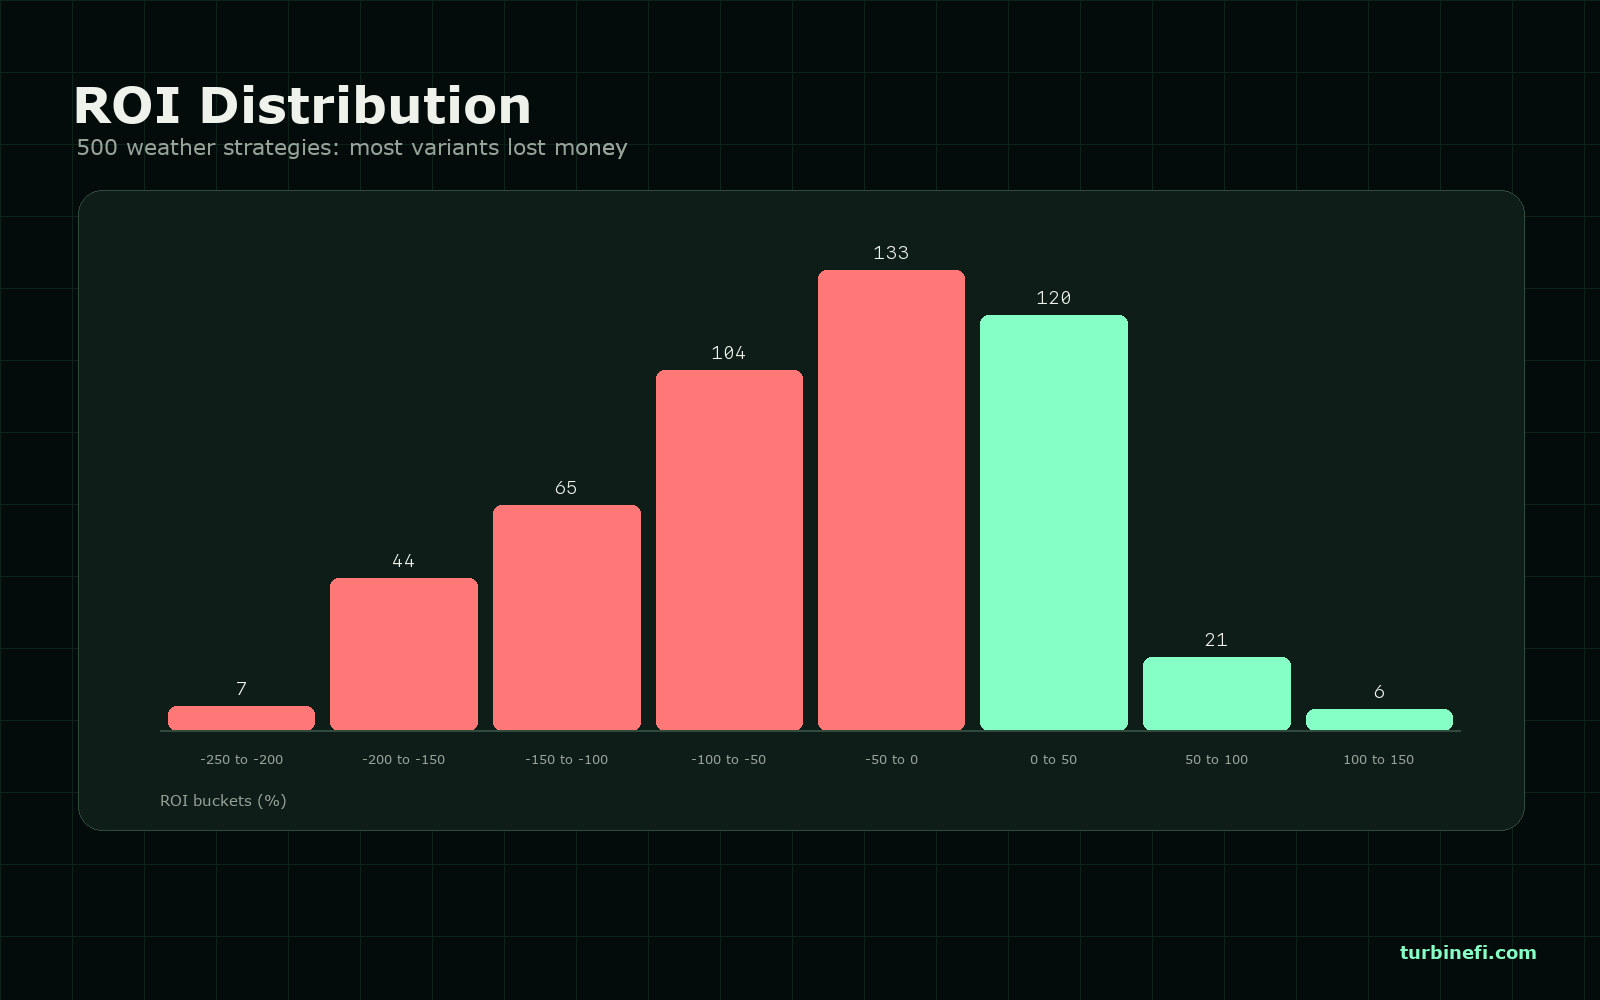
The result was not subtle: most of them lost money. Only 70 out of 500 finished positive, and the median ROI was -41.61%. So this is not a victory lap about weather markets being easy. If anything, the first lesson is that most plausible-sounding weather ideas are probably junk until proven otherwise.
But the losses were not random. The strategies that did best shared a simple shape: they used weather data to confirm a heat trade that the market had not fully priced yet. The strategies that did worst tried to fight the market because one weather variable looked bearish.
The Cleanest Winner Was Boring
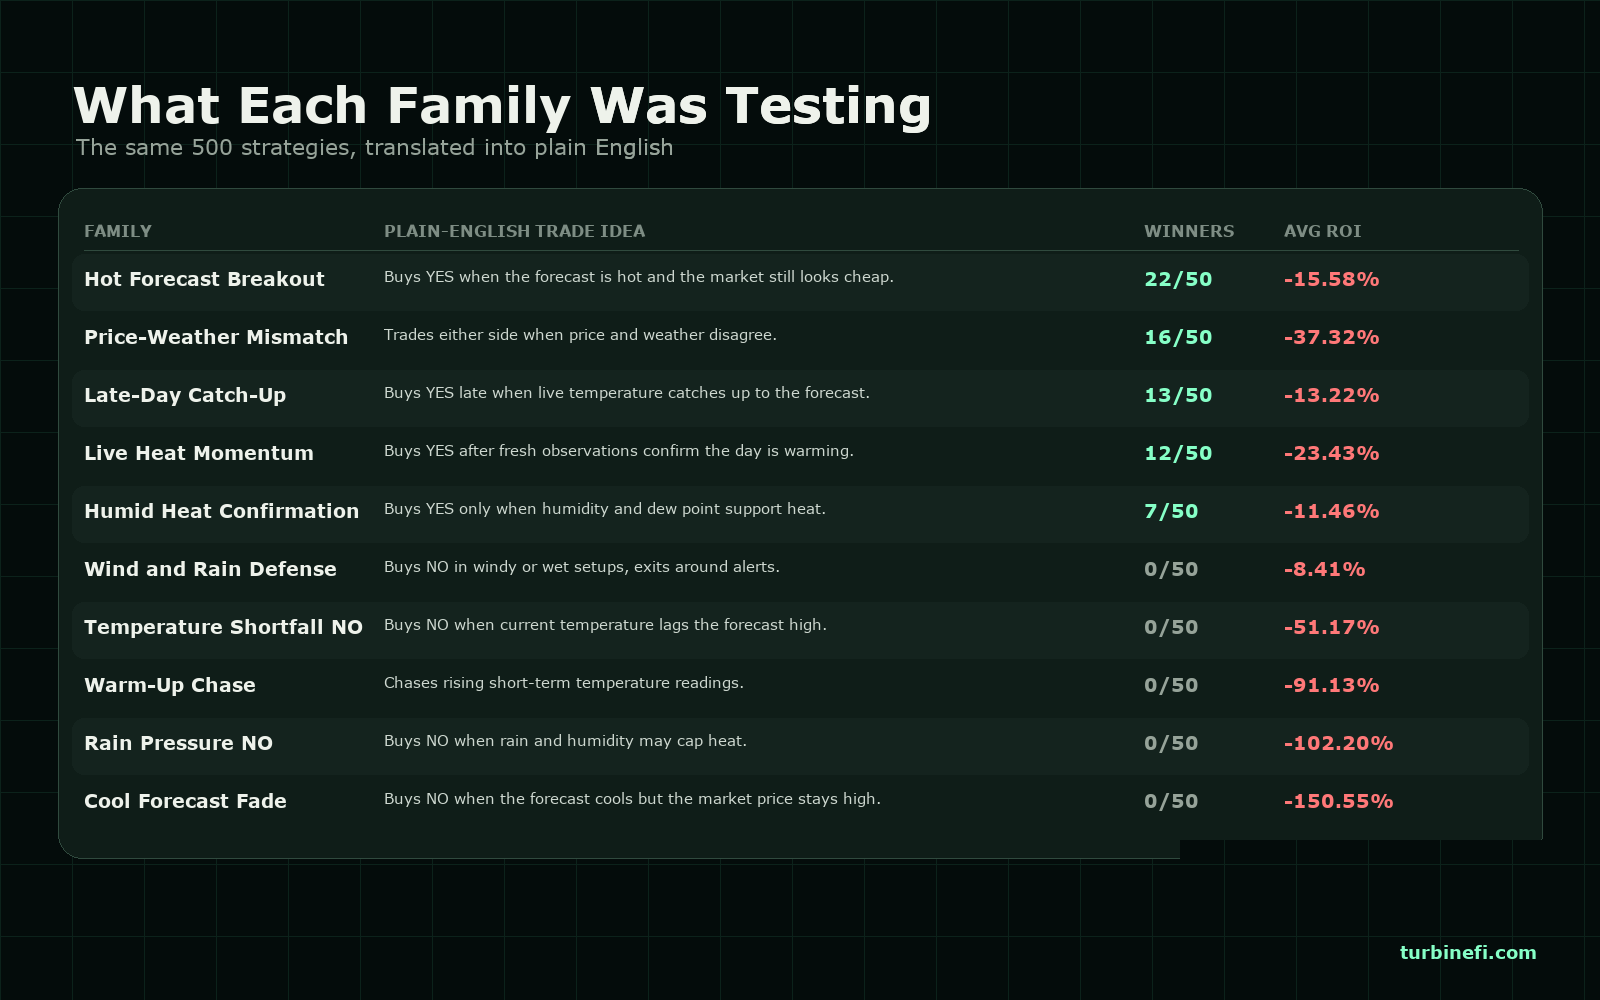
The clearest example was the Hot Forecast Breakout family. These strategies bought YES when the official forecast was hot and the YES price still looked cheap.
That group produced 22 profitable variants out of 50, more than any other family. The best individual strategy in the whole test came from this group and returned +117.75%.
What we like about that result is how boring the winning logic was. The top strategy waited for three things:
- A forecast high above 77 degrees.
- A YES price below 42 cents.
- A reasonably tight spread.
If those lined up, it bought. If the price moved up, it took profit. If the forecast cooled, it got out.
That is not a grand theory of weather markets. It is just: "the forecast says heat, the market is still cheap, take the trade."
The Thermometer Helped
That same pattern showed up in the Live Heat Momentum strategies. These waited for fresh temperature observations to confirm that the day was actually warming up before buying YES.
This family produced 12 profitable variants, including several of the top performers. The interesting part is that it was not relying on the forecast alone. It asked the thermometer to confirm the story.
The Losers Fought the Market
The bad strategies are where the test gets more useful.
Cool Forecast Fade went 0-for-50. Rain Pressure NO went 0-for-50. Temperature Shortfall NO went 0-for-50. Warm-Up Chase went 0-for-50.
These were not identical strategies, but they had the same problem: they treated a single objection to heat as enough reason to bet against the market.
A cooler forecast might matter. Rain might matter. A lagging current temperature might matter. But in this window, those signals were not strong enough on their own. The market often stayed expensive for a reason, and the strategies that interpreted every bearish weather wrinkle as an edge got punished.
The Strange Middle Case
The strangest family was Price-Weather Mismatch. It could buy either side when price and weather disagreed.
That flexibility helped it find some real winners: 16 of its 50 variants made money, and one of them returned +107.32%. But it also produced the single worst strategy in the whole run at -235.05%.
That feels like the right warning label for this kind of strategy. If you let a bot trade every disagreement between price and weather, some of those disagreements are genuine dislocations. Some are the market knowing something your rule does not.
The Takeaway
The lesson is not "use weather data." That is too broad to be useful.
The lesson is narrower: weather data seemed most useful as confirmation, not contradiction. Hot forecast plus cheap YES worked better than cool forecast plus stubbornly expensive market. Live heat confirmation worked better than trying to infer too much from rain, wind, or a shortfall from the forecast high.
We would build the next test around that.
Start with Hot Forecast Breakout as the baseline. Require stronger agreement before taking NO-side trades. Separate inactive strategies from genuinely safe ones, because a family that barely trades can look better than it is. And be careful with flexible mismatch logic; it may contain the most interesting edge, but it also needs the tightest leash.
The boring conclusion is probably the honest one: in this test, simple confirmation beat clever opposition. Weather helped when it made an already-plausible trade more obvious. It hurt when it gave the strategy an excuse to argue with price.
How We Ran It
All 500 strategies were generated deterministically and submitted to Turbine's production backtest engine. The strategies were grouped into 10 families, with 50 variants per family. Variants changed thresholds, position sizes, entry prices, exit prices, stop losses, and weather cutoffs.
The market series was Kalshi's KXHIGHNY. The external weather source was National Weather Service station KLGA at LaGuardia. The strategies used supported Turbine fields only: market price, spread, time to expiry, position size, unrealized PnL, and NWS fields such as current temperature, forecast high, humidity, dew point, precipitation probability, wind speed, and weather alerts.
If you want to run your own version of this, swap the series, change the city, try different external data, or tighten the filters. Turbine Studio lets you describe a strategy in plain English, compile it to executable strategy logic, and backtest it before risking capital.
Build a strategy that uses external data.
Caveats
This is one window, one city, one market series, and one weather station. Different cities, seasons, contract designs, and station mappings can behave very differently.
ROI is normalized to each strategy's configured risk capital. The relative ordering is more useful than the exact percentage.
Backtests use historical order book snapshots and modeled fills. Live trading can differ because of slippage, latency, liquidity, fees, changing venue behavior, and weather data availability.
Disclaimer
This post is for informational and educational purposes only. It is not investment advice, a recommendation to trade, or a solicitation to buy or sell any financial product, contract, or instrument. Turbine is not a registered investment adviser, broker-dealer, commodity trading advisor, or commodity pool operator.
The results described are from a backtest: a simulation of how strategies would have performed against historical orderbook data over a specific window on a single market series. Kalshi contracts are regulated by the U.S. Commodity Futures Trading Commission.
Hypothetical and simulated performance results have inherent limitations. They are prepared with the benefit of hindsight, do not involve real capital at risk, and cannot fully account for the impact of execution, liquidity, fees, or changes in market conditions. No representation is being made that any strategy will or is likely to achieve profits or losses similar to those shown.
Past performance, whether actual or hypothetical, is not indicative of future results. Trading prediction-market contracts involves substantial risk, including the possible loss of the entire amount invested.
Strategies described here were built and backtested by the author for research. Turbine does not recommend any of these strategies for use.
You are solely responsible for any decisions you make. Before trading any product, consider your financial situation and risk tolerance, and consult a qualified professional. Do not rely on anything in this post as the basis for a trading decision.