Does ETH Actually Lag BTC in 15-Minute Markets?
 Ryan Bajollari
BTC and ETH are highly correlated, but a 30-day spot-candle study did not find a clean one-candle BTC-leads-ETH signal. The better test is whether prediction markets reprice slower than spot.
Not investment advice. Educational research only. This is not live trading, and it is not a recommendation to trade. Full disclaimer at the end.
I wanted to test one of those crypto ideas that sounds obvious enough to be dangerous:
If BTC moves first, does ETH follow a little late?
If that lag exists, it could matter for 15-minute up/down markets. BTC rips, ETH has not fully caught up yet, buy the ETH up contract. Clean little story.
I kind of wanted this to work. It would be a nice simple bot.
But the first pass says the lazy version of the idea probably does not survive contact with the data.
What I Checked
I used Coinbase BTC-USD and ETH-USD candles from April 30 to May 30, 2026, lined them up into 5-minute and 15-minute bars, and compared log returns.
This is spot data, so it is not a backtest of live fills on Kalshi. I was only trying to answer the first question before pretending there is a trade:
Does ETH lag BTC enough to care?
Short answer: BTC and ETH move together a lot, but mostly in the same candle.
Stats:
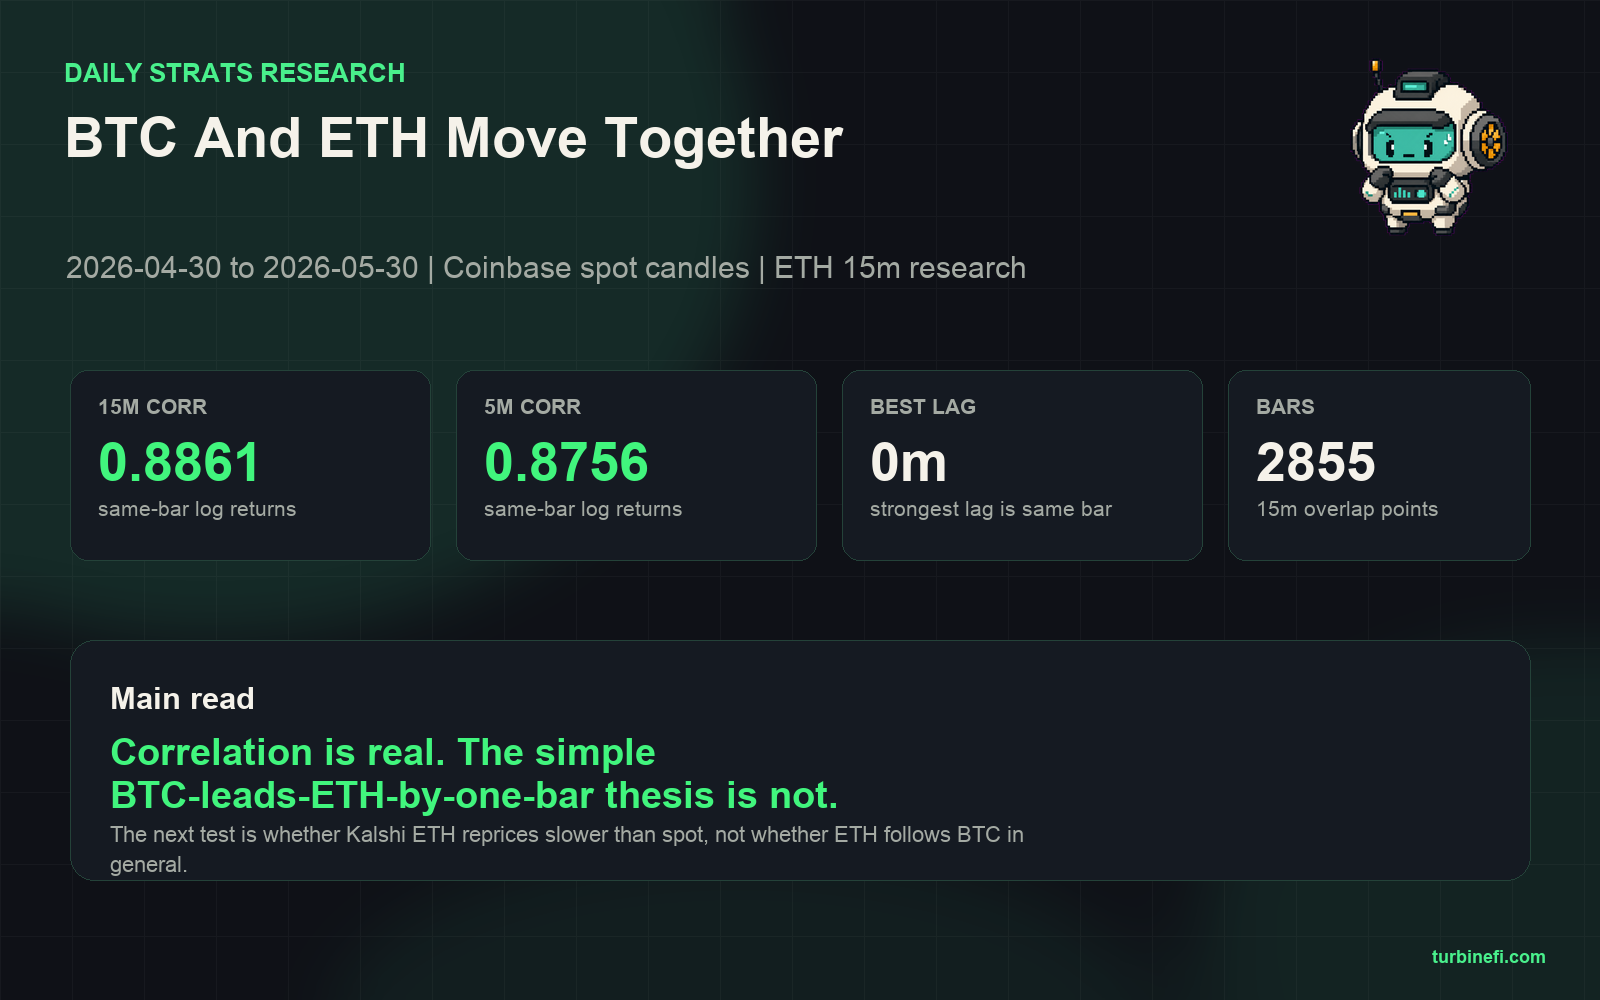
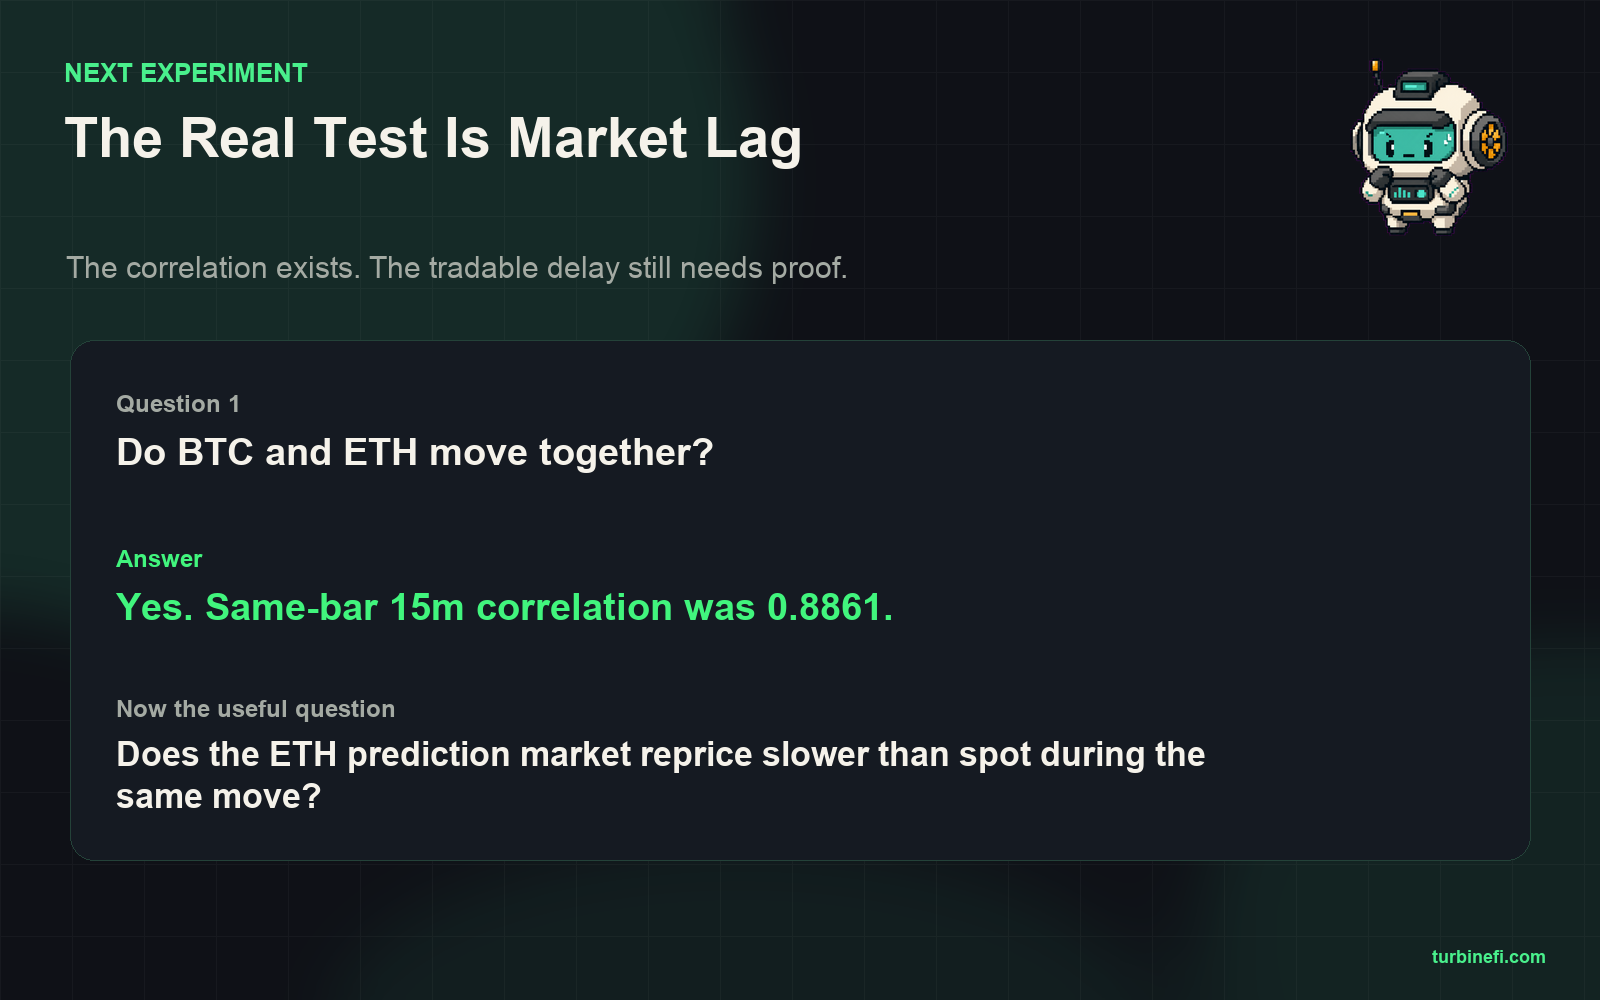
- 15-minute same-bar BTC/ETH return correlation: 0.8861
- 5-minute same-bar BTC/ETH return correlation: 0.8756
- strongest 15-minute lead/lag reading: 0.8861 at 0 minutes
- BTC leading ETH by one 15-minute candle: -0.0053
- overlap points: 2,855 15-minute bars
The Lead-Lag Test
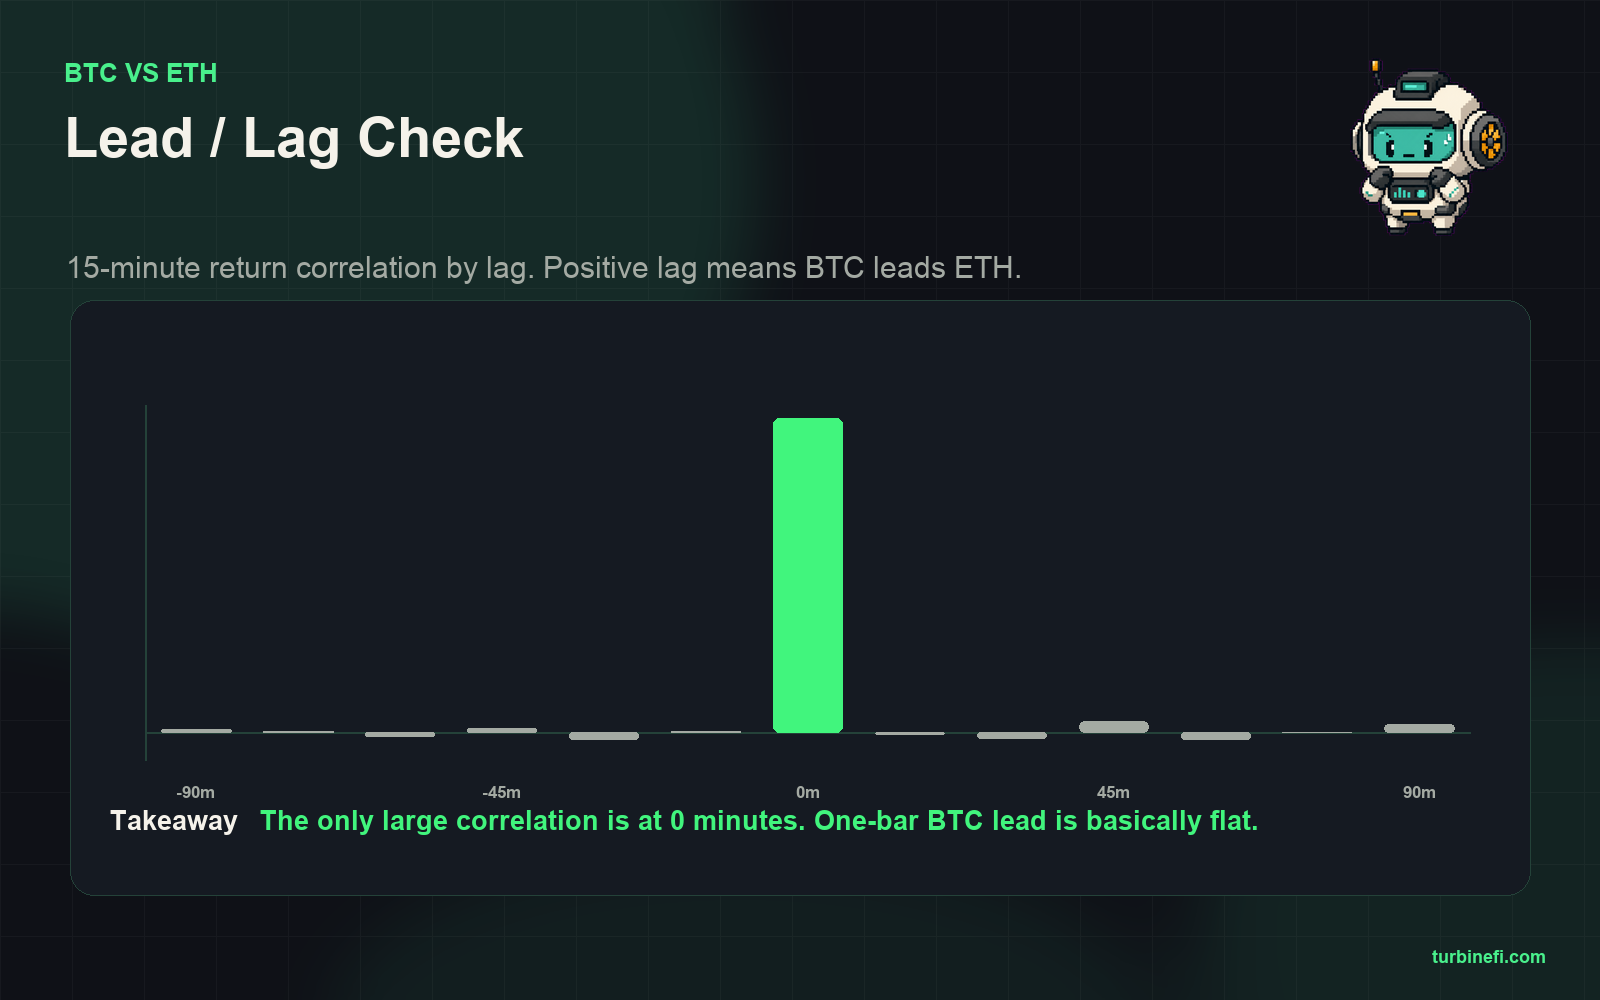
The strongest relationship showed up at 0 minutes. In plain English: BTC and ETH were moving together in the same 15-minute bar.
The one-candle BTC-leads-ETH version was basically flat.
That matters because the naive trade is not "BTC and ETH are correlated." The naive trade is "BTC moved last candle, so ETH should move this candle."
Those are different claims.
The first claim looked true in this window. The second one did not.
Direction Was Even Clearer
The direction test was the part that made me less excited.
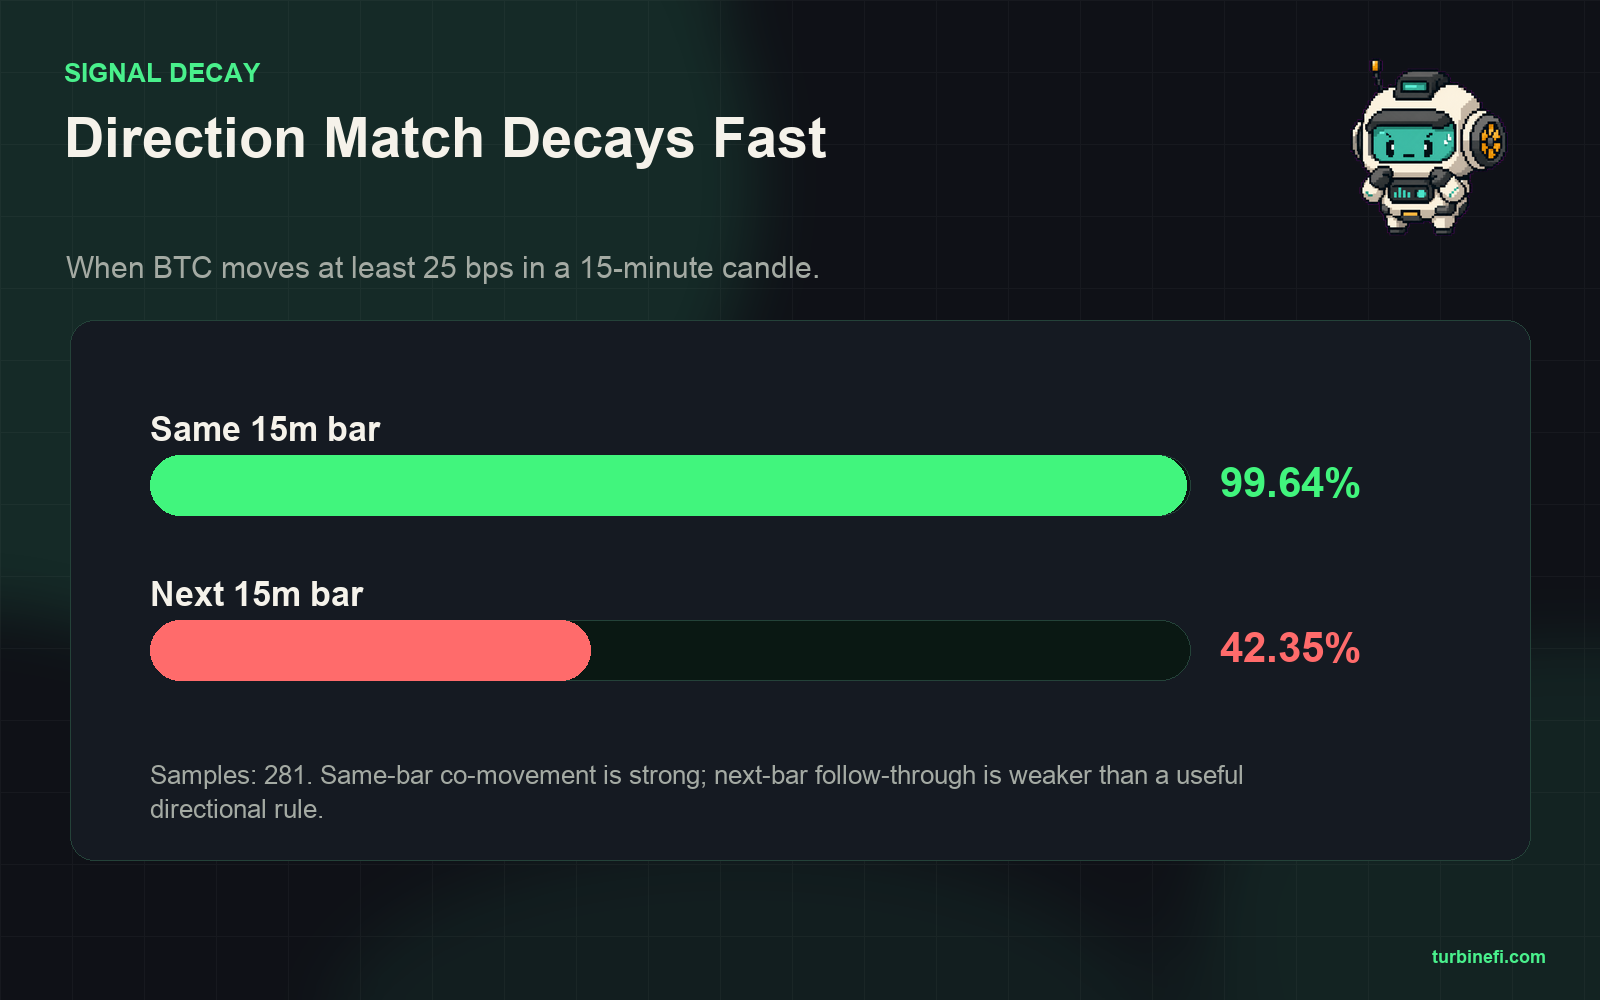
When BTC moved at least 25 bps in a 15-minute candle, ETH moved the same direction in that same candle 99.64% of the time.
In the next 15-minute candle, ETH matched BTC's prior direction only 42.35% of the time.
So the simple trade is probably dead:
BTC moved up last bar, so ETH should follow next bar.
That is not what this sample says. By the time the 15-minute candle has closed, the obvious move may already be gone. BTC and ETH did not look like a clean leader/follower pair here. They looked like two things getting repriced at the same time.
The Better Test
That does not mean there is nothing to test.
The better version is more specific:
BTC and ETH spot are moving together right now, but the ETH prediction market has not repriced yet.
That is a different trade. It is not "BTC predicts ETH." It is "spot crypto may move faster than the prediction market."
That is where I would take this next. I would stop trying to use the previous BTC candle as the signal and instead look at same-window dislocations:
- BTC and ETH spot both moving hard
- ETH up/down contract still priced like nothing happened
- enough spread and liquidity to actually get filled
- exit before the 15-minute window turns into a coin flip
My Read
BTC/ETH correlation is definitely real. BTC/ETH lag, at least at this resolution, is not obvious.
If there is an edge, it is probably in market repricing speed, not in ETH politely following BTC one candle later.
That is also why this belongs in a backtest engine instead of a spreadsheet. The useful next question is not just "do BTC and ETH correlate?" It is:
Can a strategy notice same-window spot movement, check the ETH prediction-market price, account for spread and fills, and still get paid after realistic execution?
That is the actual bot test.
You can try that shape in Turbine Studio: describe the spot-confirmation idea in plain English, compile it into strategy logic, and backtest it before putting capital at risk.
For related context, see the earlier research on Coinbase spot as a signal for Kalshi BTC 15-minute markets.
Caveats
This was one 30-day window, from April 30 to May 30, 2026. Different regimes can behave differently.
The analysis used Coinbase spot candles, not live prediction-market fills. That means the correlation result is useful for research, but it does not prove an executable strategy.
The next useful test should include the actual ETH up/down contract price, spread, fill assumptions, latency assumptions, and exit logic. A same-candle spot move only matters if the contract can still be traded at a stale enough price.
Prediction market trading carries risk. Even a good research result can fail live because of liquidity, fees, slippage, latency, venue downtime, data delays, or regime change.
Disclaimer
This post is for informational and educational purposes only. It is not investment advice, financial advice, a recommendation to trade, or a solicitation to buy or sell any financial product, contract, or instrument. Turbine is not a registered investment adviser, broker-dealer, commodity trading advisor, or commodity pool operator.
The results described are historical research based on spot-market candle data over a specific window. They are not live trading results and they are not a representation that any strategy will or is likely to achieve similar results.
Past performance, historical correlation, and hypothetical analysis are not indicative of future results. Trading prediction-market contracts involves substantial risk, including the possible loss of the entire amount invested.
You are solely responsible for any trading decisions you make. Before trading any product, consider your financial situation and risk tolerance, and consult a qualified professional. Do not rely on anything in this post as the basis for a trading decision.