Building Systematic Prediction Market Strategies From Scratch: A Quant Playbook (2026)
Renaissance Technologies' Medallion Fund returned 30% in 2024. AQR's Helix trend-following fund returned 17.9%. Two Sigma's Absolute Return Enhanced posted 14.3% (Hedgeweek, 2024). Meanwhile, 84.1% of Polymarket traders have not made a profit, and approximately 74% of Kalshi traders post losses (WSJ via BeInCrypto, 2026). The gap between systematic quant funds and discretionary retail isn't about IQ or capital. It's about process.
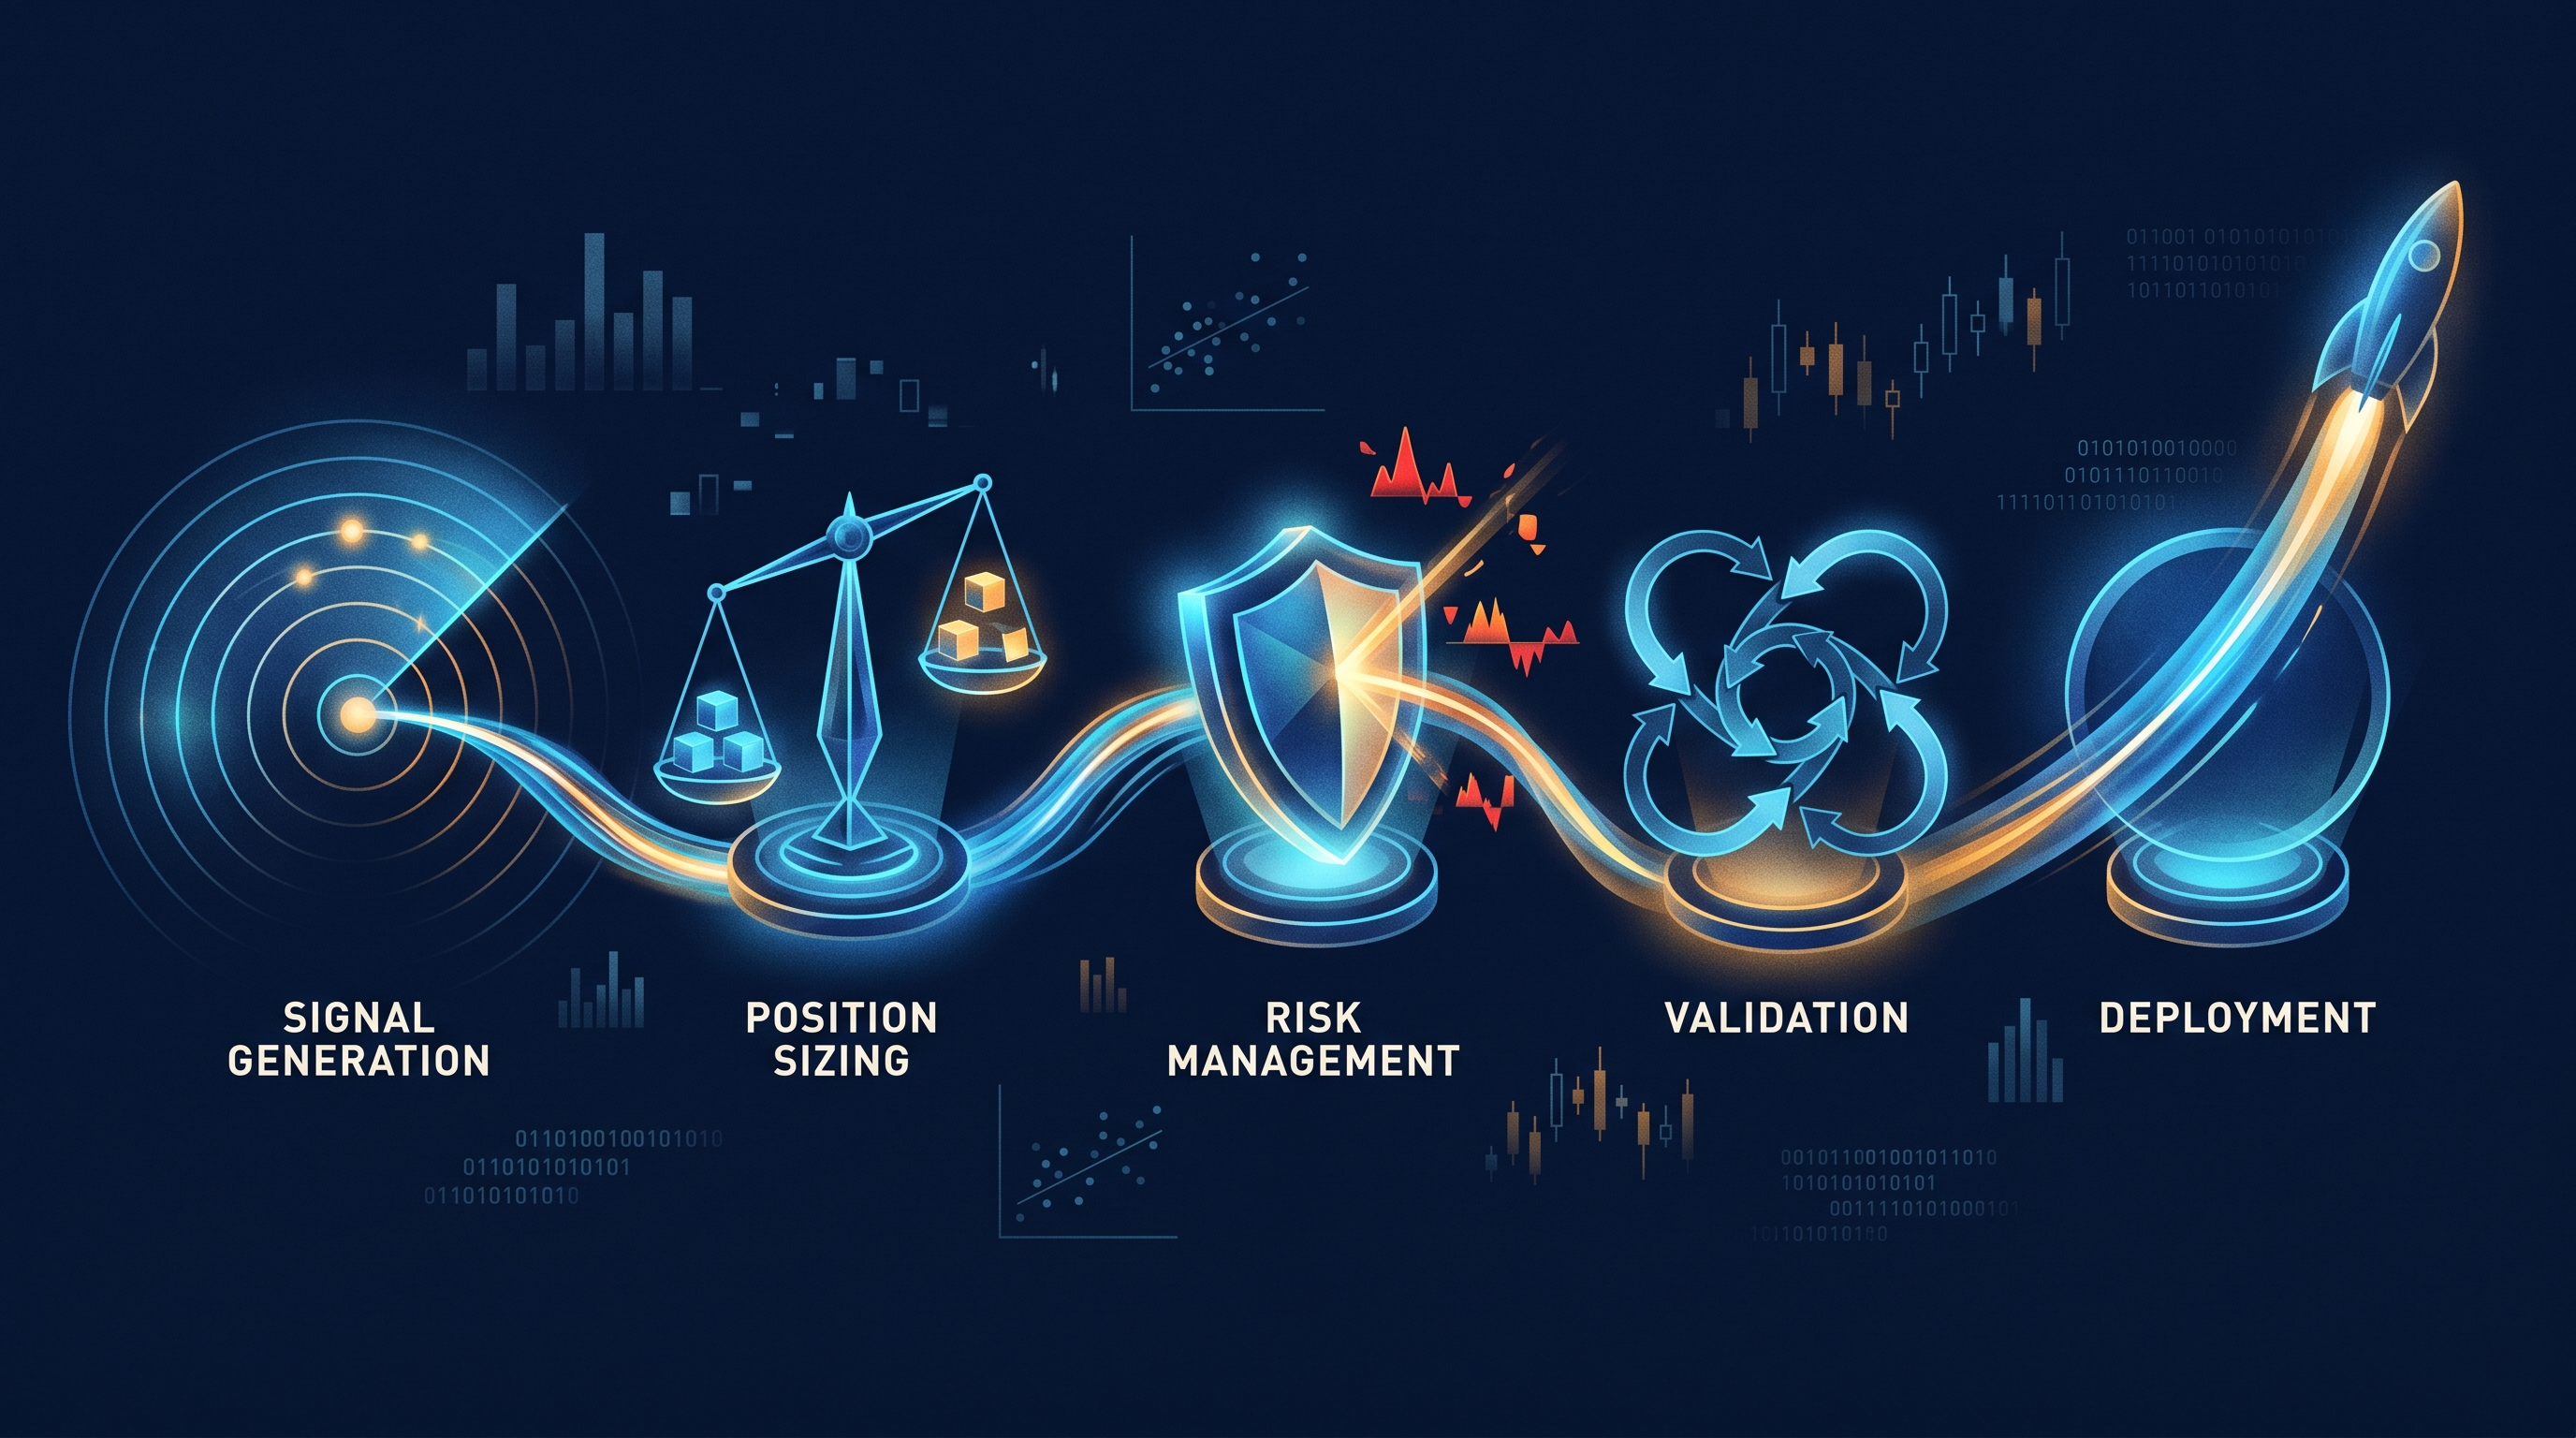
This isn't a listicle of strategies to copy. It's the design pipeline — the same five-stage workflow Renaissance, Two Sigma, and AQR use, adapted for Kalshi and Polymarket. Signal generation, position sizing, risk management, walk-forward validation, deployment. Skip any stage and your strategy joins the 84% losing column. Walk through all five and you have a system that can survive contact with live markets.
**Key Takeaways** - Renaissance Medallion +30%, AQR Helix +17.9%, Two Sigma AR Enhanced +14.3% in 2024 — systematic quants posted double-digit returns while 84% of Polymarket retail lost money ([Hedgeweek](https://www.hedgeweek.com/renaissance-tech-and-two-sigma-lead-2024-quant-gains/); [WSJ via BeInCrypto](https://beincrypto.com/prediction-market-polymarket-kalshi-users-losing-money-wsj/)) - Half Kelly position sizing delivers ~75% of full Kelly's growth rate with ~50% of the volatility ([MacLean, Ziemba & Blazenko](https://www.caia.org/sites/default/files/AIAR_Q3_2016_05_KellyCapital.pdf), Management Science, 1992) - Walk-Forward Efficiency above 50% is the minimum threshold for live deployment of any systematic strategy ([arXiv 2512.12924](https://arxiv.org/html/2512.12924v1), 2025) - 45% of retail traders now use automated strategies — up from near-zero a decade ago ([eToro Global Trading Study](https://www.etoro.com/news-and-analysis/etoro-updates/retail-investors-flock-to-ai-tools-with-usage-up-46-in-one-year/))
Why Systematic Beats Discretionary (The Numbers Behind the Gap)
The retail vs systematic gap isn't theoretical. Cross-platform retail trader studies show only ~13% of retail traders remain active after 3 years, and fewer than 5% are trading profitably after 5 years (QuantifiedStrategies). On Polymarket specifically, fewer than 0.04% of addresses captured 70% of all profits (NYT via Techmeme, Jan 2026).
Compare that to AQR's published research on systematic vs discretionary hedge funds: systematic funds tend to outperform on risk-adjusted measures, with significantly more consistent return distributions (AQR Capital). Harvey and Liu at Duke ran the comparison directly — systematic funds win on Sharpe even when total returns are similar (Harvey & Liu).
What systematic funds have that discretionary traders don't: a repeatable process. Every signal is defined in code. Every position size follows a sizing rule. Every risk parameter is enforced before a trade lands. Every backtest passes through validation gates. Every deployment goes through paper trading and a canary phase.
That's the playbook. Here's how to build it.
Step 1: Signal Generation (What's Your Edge?)
A trading strategy starts with a signal — a measurable input that predicts future market movement. For prediction markets, four signal families work:
News sentiment. A 2025 study analyzing 1.86 million headlines found forward-looking implied sentiment captured 45-50% of stock return variation (MDPI Journal of Risk and Financial Management, 2025). Prediction markets, being event-driven, are even more sentiment-sensitive than equities. Political markets respond to polling-news flow within seconds. Sports markets respond to injury reports.
Polling and survey data. Public polls update slowly relative to market price. The gap between latest poll and current market price is itself a signal — particularly when polls disagree with each other.
Sports statistics. Lineup changes, weather, injury reports, head-to-head matchup data. For Kalshi's sports markets, a model that incorporates basic team analytics (effective field goal %, defensive efficiency, etc.) consistently outperforms naive favorites.
On-chain data (Polymarket-specific). Wallet behavior, large position changes, new whale activity. Polymarket's Polygon smart contracts make this data fully public — and it's underused.
A QuantPedia analysis found Polymarket leads Kalshi in price discovery, with cross-platform arbitrage opportunities lasting seconds to minutes (QuantPedia, 2025). If your signal captures information faster than the slower platform updates, that's edge.
For deeper signal-development methodology, see our data-as-edge breakdown and the five strategy archetypes post.
**What separates a good signal from a bad one:** A good signal predicts future returns *and* has economic logic. A bad signal predicts past returns and works only in-sample. If you can't explain in one sentence why your signal should generate edge, it's data mining.
Step 2: Position Sizing (How Much to Bet?)
Once you have a signal that predicts directionally, the next question is: how much capital to deploy on each signal instance?
The canonical answer is the Kelly criterion, developed at Bell Labs in 1956. For a binary prediction market contract, the formula is:
f* = (b · p − q) / b
Where:
f*= optimal fraction of capital to betb= payoff odds (e.g., for a contract at 25¢, b = 3, since you bet 25¢ to win 75¢)p= your estimated probability of winningq = 1 − p
Full Kelly maximizes long-term geometric growth. The problem: it also maximizes volatility. MacLean, Ziemba, and Blazenko's foundational paper in Management Science showed that Half Kelly delivers about 75% of full Kelly's growth rate with about 50% of the volatility (MacLean, Ziemba & Blazenko, 1992; via CAIA).
For prediction markets specifically, Half or Quarter Kelly is the standard. Two practical reasons:
- Your
pestimate is itself noisy. Full Kelly assumes you knowpprecisely. You don't. The fractional Kelly accounts for that uncertainty. - Prediction market liquidity is event-dependent (the Polymarket Kyle's-lambda swing covered in our overfitting post). Full Kelly bets can hit position limits or move the market against you.
Practical rule: Start with Quarter Kelly. Scale to Half Kelly only after 30+ resolutions of consistent live performance. Full Kelly is for traders who've never experienced a regime change. Don't be one of them.
Step 3: Risk Management (How to Survive Bad Streaks)
Position sizing controls per-trade risk. Risk management controls portfolio-level survival. Three rules every systematic strategy needs:
1. Daily drawdown limit. Hard stop at a fixed percentage (5-10% for most retail systems). If your strategy hits that limit, no more entries that day. This isn't about being conservative — it's about preventing a bad signal day from compounding into a strategy-killing one.
2. Per-market position cap. No single Kalshi event or Polymarket contract should represent more than 10-15% of your portfolio. Single-name markets especially — Stanford's adverse selection study showed informed flow hits single-name markets twice as hard as broad-based ones (Stanford Law, Apr 2026).
3. Correlation management. If you hold five contracts that all pay on the same underlying (e.g., five Kalshi BTC contracts at different strikes), your effective exposure is correlated. Treat correlated positions as a single position for sizing purposes.
The retail discretionary failure mode: doubling down after a loss to "make it back." Systematic strategies remove that decision from the trader and put it in the code. The code doesn't tilt.
Step 4: Validation (Does Your Strategy Actually Work?)
Most retail backtests are lies — sometimes accidental, sometimes deliberate. McLean and Pontiff's seminal study of 97 published predictors found returns drop 26% out-of-sample and 58% post-publication (McLean & Pontiff, Journal of Finance, 2016). QuantPedia's analysis of 355 strategies put the Sharpe ratio degradation at 33% mean / 44% median (QuantPedia).
Your validation gate needs four pieces:
Walk-forward analysis. Train on a rolling window (e.g., months 1-6), test on the next month, then expand the training window forward. Never test on data your model has seen. Walk-Forward Efficiency above 50% is the deployment threshold (arXiv 2512.12924, 2025).
Deflated Sharpe Ratio. Track the number of strategy variants you tested. Apply the DSR adjustment from Bailey & Lopez de Prado (SSRN 2460551, 2014). If your deflated Sharpe is below 1.0, you have selection noise, not a strategy.
Probability of Backtest Overfitting (PBO). Run the test from Bailey, Borwein, Lopez de Prado & Zhu (SSRN 2326253, 2014). PBO above 50% means the strategy is more likely overfit than not.
Out-of-sample hold-out. Reserve 25-30% of historical data that you never touch during development. Use it as the final test before deployment.
We covered all four in detail in last week's overfitting playbook. The point worth repeating here: every quant fund has this gauntlet built into their workflow. It's not optional.
Step 5: Deployment (Bridging to Live Capital)
A backtest that passes Step 4 still has to survive live execution. Three deployment phases:
Paper trading (2-4 weeks). Run the strategy on live data feeds with no real money. The goal: catch differences between backtest assumptions and live execution. Common issues: websocket disconnects, fill rate mismatch, latency surprises, fee surprises.
Canary live (2-4 weeks). Deploy with 10-20% of intended capital and hard daily-drawdown stops. The goal: verify live performance tracks paper performance within tolerance. If it diverges, halt before scaling.
Full live deployment. Scale to intended capital only after both prior phases pass. Even then, monitor live-vs-backtest drift weekly. Strategies decay. The question isn't whether yours will, only when.
The 2012 Knight Capital blowup was a deployment failure — untested code activated in production cost $440M in 45 minutes (Wikipedia: Knight Capital). LTCM in 1998 was a validation failure — correlation assumptions held in backtest, failed in live. Don't be either case study.
Why Manual Trading Loses to Systematic Trading
The eToro Global Trading Study found 45% of retail traders now use automated strategies, up from near-zero a decade ago (eToro). On Polymarket, AI agents now represent over 30% of wallet activity. Fourteen of the top 20 most profitable Polymarket wallets in 2025 were automated (Finance Magnates).
The reason isn't that bots are smarter. It's that bots are consistent:
- They size every position the same way
- They enforce every risk limit
- They don't skip the canary phase because they're impatient
- They don't double down after a loss
- They don't move stop losses
- They don't trade when tired
A median discretionary trader on Polymarket makes 12 trades over 90 days with $224 in median total investment (Odaily). A median bot trades 89 times per day (Bloomberg). The bot's edge isn't speed — it's repeatability at scale.
For more on the structural asymmetry, see our why retail loses post.
Common Mistakes (and How to Avoid Them)
Mistake 1: Building the strategy before the validation pipeline. Most retail traders build a strategy, then try to figure out how to validate it. Reverse it. Build the validation gauntlet first. Then any strategy that passes through it has cleared a real bar. We covered the full validation workflow in last week's overfitting post.
Mistake 2: Full Kelly sizing. Full Kelly assumes you know your edge precisely. You don't. Even Renaissance uses fractional sizing on most positions. Half or Quarter Kelly is the standard.
Mistake 3: Ignoring transaction costs in backtests.
Kalshi fees follow the 7% × p × (1-p) formula, capped at $0.0175 per contract. Polymarket fees range from 0% (geopolitics) to 0.07% (crypto). Backtest with realistic fee assumptions — preferably the maker side, since you should be using limit orders. See our affordable bots post for the full fee breakdown.
Mistake 4: Skipping paper trading. Paper trading is the cheapest way to catch live-vs-backtest divergence. Skipping it to "save time" costs more than it saves on average.
Mistake 5: Treating one good backtest as proof. A single backtest run is a data point. Run 100. Apply Deflated Sharpe. If the deflated metric still passes, you might have something. If it doesn't, you don't.
What This Looks Like in Turbine Studio
[PERSONAL EXPERIENCE] Turbine Studio's product is essentially this playbook automated. You describe a signal in plain English. Turbine compiles it into inspectable strategy logic. The backtester runs walk-forward by default, computes Deflated Sharpe automatically, and surfaces PBO when you've tested multiple variants. Position sizing is Half Kelly out of the box, with overrides for traders who want more or less aggressive. Risk limits enforce at the deploy gate. Deployment goes through paper → canary → full live with explicit promotion steps.
You don't have to use Turbine to use the playbook. The methodology is public. We just packaged it so retail traders can use the same pipeline systematic funds use. See Turbine Studio plans.
Frequently Asked Questions
Can a retail trader actually beat the market systematically?
Possible, hard. The eToro data shows 45% of retail traders now use some form of automation, but only ~1% achieve long-term success (QuantifiedStrategies). The difference between the 45% who try and the 1% who succeed is process discipline — not access to better tools.
What's the minimum edge needed for systematic prediction-market trading?
Depends on fees and bet frequency. A strategy with 53% accuracy on 50¢ Kalshi contracts (where fees peak at 3.5%) needs careful sizing to net out. 55% accuracy clears most fee structures. Below 53%, fees eat the edge.
Should I use machine learning for prediction market strategies?
Yes, but with extra discipline. ML's flexibility makes overfitting worse. Use purged cross-validation and combinatorial walk-forward methods (Hudson & Thames). Most retail ML strategies fail validation because they don't apply these — they apply naive k-fold and ship strategies that look great until live.
How long should I paper-trade before going live?
Two to four weeks minimum for daily-frequency strategies. For higher-frequency strategies (15-minute Kalshi crypto contracts), aim for 100+ resolution events. The point is enough live observations to verify your backtest assumptions hold.
What's the most important step in the playbook?
Validation (Step 4). Most retail traders fail there. Get validation right and the other steps fall into place. Skip it and the other steps are theater.
The Bottom Line
The 84% of Polymarket traders who haven't profited and the 74% of Kalshi traders who post losses aren't there because they lack intelligence. They're there because they're running an undisciplined process against a 30%-bot counterparty pool. Systematic quant funds — Renaissance, Two Sigma, AQR — post double-digit returns by running a disciplined one.
The five-step playbook isn't proprietary:
- Signal generation — economic logic + measurable input
- Position sizing — Half or Quarter Kelly with edge uncertainty
- Risk management — per-trade, per-market, portfolio-level limits enforced in code
- Validation — walk-forward, DSR, PBO, OOS hold-out
- Deployment — paper → canary → full live with promotion gates
You can build all five from scratch in Python. You can build them with Turbine Studio. The methodology matters more than the tooling. Start with Turbine if you want the playbook packaged. Build it yourself if you want full control. Just don't skip steps.
This article is for educational purposes only. Systematic trading involves substantial risk of loss. Past performance does not guarantee future results. Validate every strategy in paper trading and canary deployment before scaling.