Why Your Backtest Said +20% But Live Trading Lost Money (Prediction Market Overfitting Explained)
McLean and Pontiff studied 97 published return predictors in the Journal of Finance and found that, on average, real out-of-sample returns are 26% lower than the in-sample backtest. After the strategy is published and the public knows about it, returns drop 58% (McLean & Pontiff, Journal of Finance, 2016). A separate QuantPedia analysis of 355 strategies found Sharpe ratios degrade by 33% on average — 44% at the median when you move from in-sample to out-of-sample (QuantPedia).
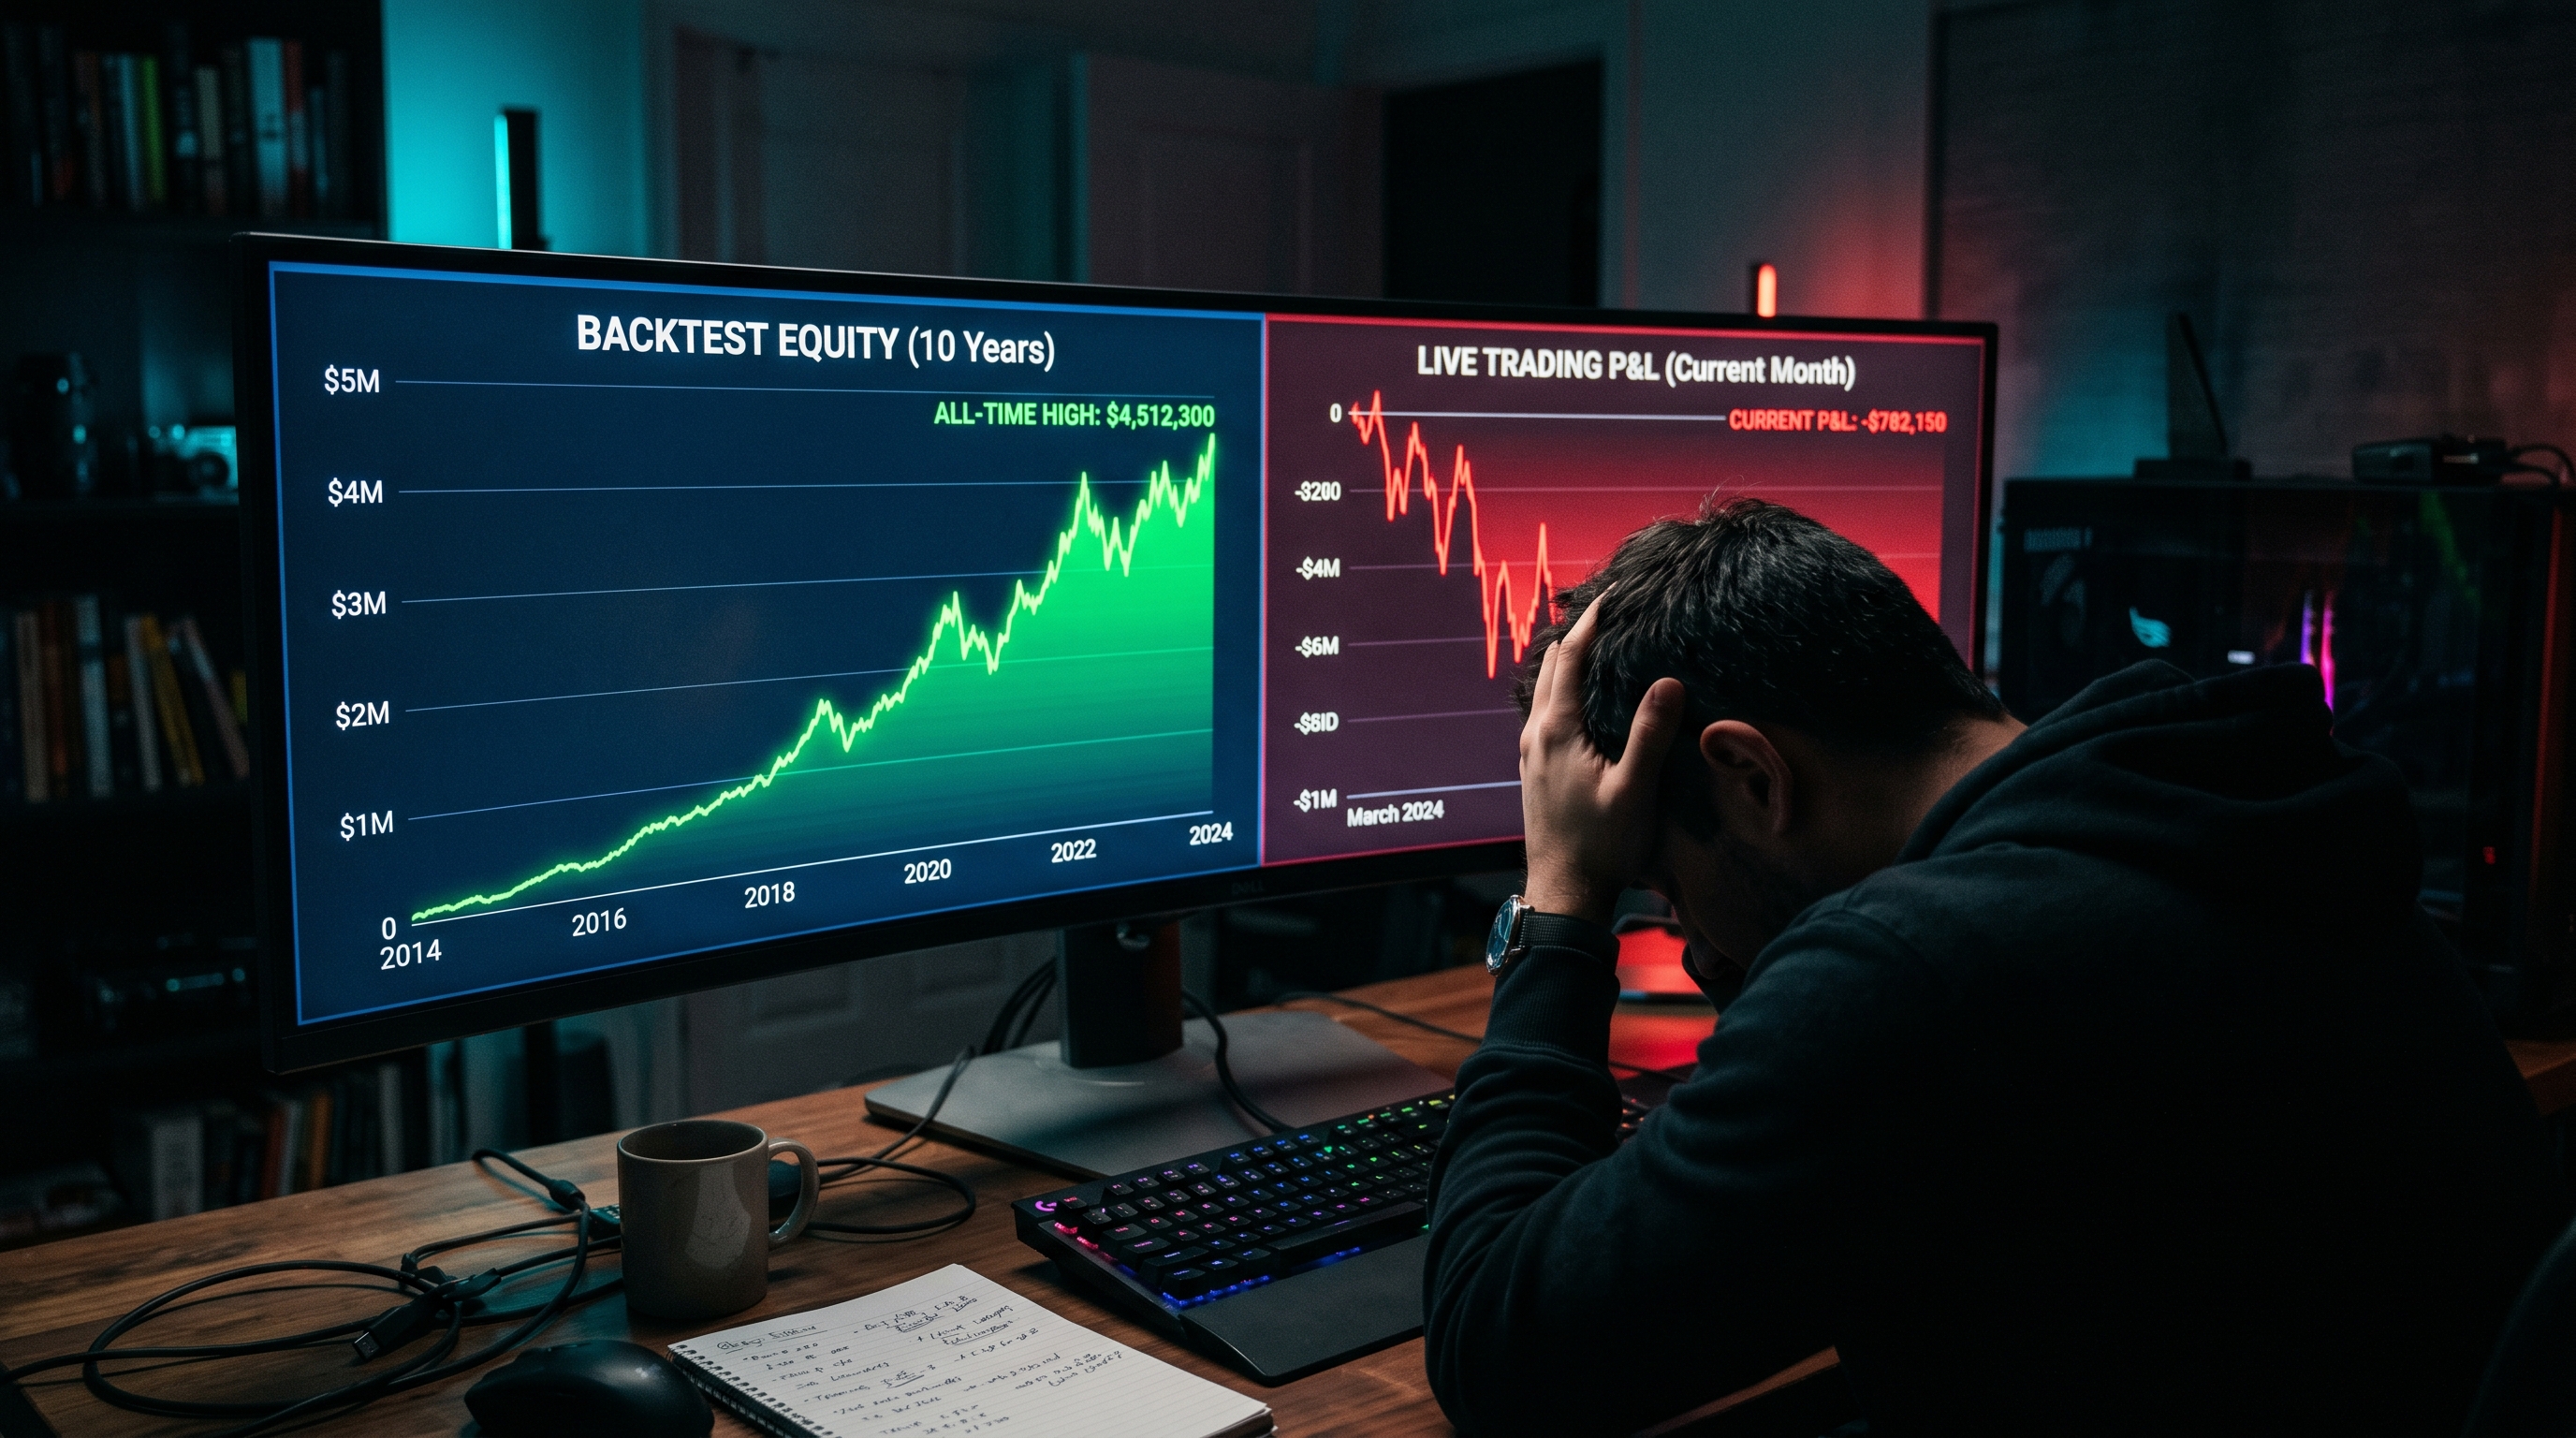
If your Kalshi or Polymarket bot showed +20% in backtest and lost money live, you're not unlucky. You're hitting the math head-on. Marcos Lopez de Prado's work on the Deflated Sharpe Ratio shows that running just three backtest trials is enough to start producing strategies that look statistically significant but aren't (Bailey & Lopez de Prado, SSRN, 2014). Here's why backtests lie — with three prediction-market-specific failure modes that don't exist in equities — and the five-step playbook to harden a strategy before it goes live.
**Key Takeaways** - Backtested returns drop 26% out-of-sample and 58% post-publication on average ([McLean & Pontiff](https://onlinelibrary.wiley.com/doi/abs/10.1111/jofi.12365), 2016) - Sharpe ratios degrade 33% mean / 44% median across 355 strategies tested for out-of-sample robustness ([QuantPedia](https://quantpedia.com/in-sample-vs-out-of-sample-analysis-of-trading-strategies/)) - The October 2025 crypto crash liquidated $19B in 14 hours with BTC liquidity collapsing 98% — a textbook regime-change event no backtest had seen ([FTI Consulting](https://www.fticonsulting.com/insights/articles/crypto-crash-october-2025-leverage-met-liquidity), Oct 2025) - Walk-forward validation + Deflated Sharpe Ratio + canary deployment are the three filters that catch overfitting before live capital does
What Is Backtest Overfitting? (Why Backtests Lie)
A backtest is a curve-fitting exercise. You take historical data, try a bunch of parameter combinations, and keep the one that produces the best equity curve. The problem: if you try enough combinations, you'll always find one that fits the past — even if there's no real edge in the data (Bailey, Borwein, Lopez de Prado & Zhu, 2014).
McLean and Pontiff quantified this for the academic literature in 2016. They picked 97 published return predictors — each peer-reviewed, each with a statistically significant in-sample backtest — and tracked what happened after publication. Returns dropped by an average of 26% just from re-running the same predictor on data the authors hadn't seen. Once the strategy was published and other traders could use it, the average drop hit 58%. Some predictors went entirely flat (McLean & Pontiff, Journal of Finance, 2016).
For more on how this plays out specifically on Kalshi crypto contracts, see our 1000-strategy backtest case study and our Coinbase-spot edge backtest of 100 strategies. Both walk through the live-vs-paper gap with real data.
The Deflated Sharpe Ratio: How to Know If Your Backtest Is Real
Marcos Lopez de Prado is the most-cited person working on this problem. His Deflated Sharpe Ratio (DSR) gives you a way to discount a backtested Sharpe by the number of trials you ran to find it (Bailey & Lopez de Prado, SSRN, 2014).
The intuition: if you try 100 random strategies and pick the best one, even a strategy with no real edge will look good. The Sharpe ratio it shows you isn't the "true" Sharpe — it's the best-of-100 Sharpe, which is much higher than any individual strategy's expected Sharpe.
**The DSR formula, in plain English:** A strategy showing an annual Sharpe of 2.5 after 100 backtest trials, run on 1,250 days of data with skew -3 and kurtosis 10, has only about a 90% probability of having a true positive Sharpe ratio at all. The "2.5" is mostly selection noise ([Deflated Sharpe Ratio](https://en.wikipedia.org/wiki/Deflated_Sharpe_ratio); [Bailey & Lopez de Prado](https://papers.ssrn.com/sol3/papers.cfm?abstract_id=2460551), 2014).
The September 2025 paper from Lopez de Prado, Lipton, and Zoonekynd lists five Sharpe ratio mistakes that pop up in nearly every retail backtest: reporting point estimates without significance bands, assuming iid-Normal returns, ignoring test power, misinterpreting p-values, and failing to correct for multiple testing (Lopez de Prado, Lipton & Zoonekynd, Sep 2025).
The Harvey-Liu-Zhu factor zoo paper put the bar even higher. Of 316 "factors" academic finance has claimed drive stock returns, the majority are likely false discoveries. To clear the multiple-testing hurdle, a new factor needs a t-statistic above 3.0, not the conventional 2.0 (Harvey, Liu & Zhu, NBER, 2016). The same logic applies to retail backtests: if you tried 50 strategy variants, the one that shows 2-sigma significance probably isn't significant at all.
Three Backtest Killers Specific to Prediction Markets
Most overfitting content covers equities, FX, or generic crypto. Prediction markets have three extra failure modes that don't exist in continuous-payoff assets:
1. Binary resolution dynamics. Kalshi YES/NO contracts don't roll — they settle at $1 or $0. A strategy that backtested well on partial resolutions might fail dramatically on a single resolution event. If your backtest didn't include enough resolutions (typically 30+) you don't have a real sample.
2. Time decay near settlement. As a contract approaches resolution, implied probabilities snap toward 0 or 100. Strategies that look profitable in the middle of a contract's life often blow up in the final 30 minutes because the orderbook gets thin and the price discovery accelerates. Backtests using mid-quote prices systematically over-estimate fill rates here.
3. News-event illiquidity. Liquidity on prediction markets is event-dependent. The "Anatomy of Polymarket" arXiv paper showed Kyle's lambda — the standard price-impact measure — dropping from approximately 0.518 in early 2024 to 0.01 in October 2024 on the 2024 election cycle. That means a $1M order moved prices about 13 percentage points early in the cycle but only ~0.25 percentage points by October (arXiv 2603.03136, 2026). A backtest that doesn't account for that 50x liquidity swing will mis-model fills by orders of magnitude.
Vanderbilt's Clinton-Huang study reinforced the regime-change point with 2,500 markets and $2.5B of volume. Only 78% of Kalshi markets and 67% of Polymarket markets beat chance — and "a lot of the volatility was due to within-market actions and reactions, with traders reacting to each other rather than to political reality" (DL News, 2025). Reflexive trader-to-trader feedback loops aren't in any backtest dataset.
The October 2025 Crypto Crash: A $19B Lesson in Regime Change
The cleanest recent example of how regime changes kill bots: October 10-11, 2025. In about 14 hours, $19 billion in leveraged crypto positions were liquidated. $3.21 billion vanished in a single minute at 21:15 UTC. Visible BTC liquidity on perpetual exchanges collapsed from $103.64 million to $0.17 million — a 99.8% drop. Bid-ask spreads widened by 1,321x. Eighty-seven percent of liquidated value was on the long side (FTI Consulting, Oct 2025; Amberdata, Oct 2025).
No backtest covering 2024 included that scenario. Every strategy that relied on tight crypto spreads, dependable liquidity, or low slippage assumptions blew up. The lesson generalizes to prediction markets: when Kalshi sees breaking news, when Polymarket sees an election surprise, when a sports market hits a lineup change — your fill assumptions stop working in the same way. The backtest doesn't know what it doesn't know.
Knight Capital and LTCM: How Untested Code and Stale Correlation Killed Two Giants
The two canonical case studies in deployment failure both come down to the same root cause: backtests that didn't include the live regime.
Knight Capital, August 1, 2012. An untested code deployment activated dormant "Power Peg" logic on one of eight production servers. In 45 minutes, Knight executed over 4 million orders on 154 stocks. The total loss was approximately $440 million. The stock fell 75% in two days and Knight was acquired within weeks (Wikipedia: Knight Capital Group, 2012). The strategy was fine in backtest. The deployment wasn't.
Long-Term Capital Management, August 1998. LTCM lost 44% of its value in a single month after Russia's bond default. Their value-at-risk model was calibrated on a dataset that excluded both the 1987 crash and the 1994 bond crisis. As the CFTC's official post-mortem put it, "simultaneous shocks to many markets confounded expectations of relatively low correlations" (Federal Reserve History, 1998). Their correlation assumptions held in the backtest. They didn't hold in the regime.
You're not running LTCM. But the same failure pattern — model trained on a benign regime, deployed into a turbulent one — kills retail bots every month, especially during news-driven prediction market events.
The 5-Step Defense Playbook
You can't eliminate overfitting. You can build a pipeline that catches most of it before live capital is at risk:
1. Walk-forward validation (not k-fold). K-fold cross-validation mixes future and past data, leaking lookahead information. Walk-forward runs the strategy on a rolling window: train on months 1-6, test on month 7, then train on months 1-7, test on month 8, and so on. Walk-Forward Efficiency (WFE) above 50% is the rule-of-thumb minimum for deployment (arXiv 2512.12924, 2025).
2. Deflated Sharpe Ratio on every backtest run. Track how many strategy variants you tried. Apply the DSR adjustment (Wikipedia formula). If your deflated Sharpe drops below 1.0 after the correction, you don't have a strategy — you have selection bias.
3. Out-of-sample hold-out with PBO calculation. Reserve 25-30% of your data and never touch it during development. Once you have a candidate strategy, run the Probability of Backtest Overfitting (PBO) test (Bailey, Borwein, Lopez de Prado & Zhu, 2014). If PBO is above 50%, the strategy is more likely than not overfit.
4. Paper trading bridge. Run the strategy on live data with no money for 2-4 weeks. The point isn't to learn the strategy works — you already backtested it. The point is to catch differences between your backtest assumptions and live execution: latency, fill rates, fee surprises, websocket gaps.
5. Canary live deployment. Deploy with strict risk limits — 10-20% of intended capital, hard daily drawdown stops. If the canary period (2-4 weeks) tracks paper trading within tolerance, scale up. If it diverges, you've caught a problem before it bankrupted you.
This is also why we built walk-forward validation directly into Turbine Studio's backtester. The defensive workflow is mandatory, not optional.
Why This Connects to the Adverse Selection Problem
There's a subtle interaction worth flagging. Last week's post on why retail traders get picked off showed that bots trade 89 times per active day vs 2.2 for humans, and that 0.1% of accounts capture 67% of profits (Bloomberg, Apr 2026; WSJ via Crypto Times, May 2026).
A naive overfit backtest pattern: you run 100 strategy variants on historical Kalshi data, pick the one with the highest Sharpe, and deploy it. The deployed strategy gets adversely selected by faster traders who already know the patterns. Your live equity curve diverges sharply from backtest — not because the strategy is "wrong" but because backtest fills are mid-quote and live fills are stale-side. The overfitting compounds with the microstructure problem.
The fix is the same: paper trade → canary → measure live-vs-backtest drift → scale only when they track.
What This Looks Like in Turbine Studio
[PERSONAL EXPERIENCE] When we shipped Turbine Studio's backtester, walk-forward validation was the second feature we built (the first was the historical Kalshi data pipeline). Every backtest in Turbine runs walk-forward by default. We also expose Deflated Sharpe and surface PBO when users run multiple variants.
The deployment workflow forces you through paper → canary → full live, with risk limits enforced at each stage. You can't just hit "deploy" — you have to verify the live performance tracked the paper performance first. See Turbine Studio plans.
Frequently Asked Questions
Why did my backtest show 20% returns but I'm losing live?
The three most common causes: (1) you tried too many strategy variants and picked a selection-noise winner (apply Deflated Sharpe); (2) your backtest used mid-quote fills but live trading crosses the spread (always model slippage); (3) the market entered a regime your backtest didn't include (paper-trade for 2-4 weeks before going live). All three are usually present together.
How many backtest trials should I try before deflating my Sharpe?
Track every trial. The DSR formula adjusts based on the number of distinct strategies/parameter sets tested. If you tried 100 variants and your raw Sharpe is 2.0, the deflated Sharpe might be 0.5 — meaning what looked like edge was selection noise. Lopez de Prado's worked example shows a 2.5 raw Sharpe needing 100+ trials to fall below 90% probability of true positive (Wikipedia: Deflated Sharpe Ratio).
Can I use machine learning to find prediction market strategies?
Yes, but ML makes overfitting worse if you don't apply purged cross-validation and combinatorial walk-forward methods (Hudson & Thames, 2025). ML's flexibility is exactly what produces false-positive strategies on small samples. Use it with discipline or you'll spend live capital learning the lesson.
What's the minimum sample size for a reliable backtest?
It depends on the strategy frequency. For Kalshi daily-close strategies, 250+ trading days is the floor — and that's a soft floor. For 15-minute crypto contracts, you want 30,000+ events. The McLean-Pontiff degradation suggests even that isn't enough: their 97 predictors used decades of equities data and still lost 26% out-of-sample.
How do walk-forward and k-fold cross-validation differ?
K-fold randomly splits your dataset into N folds, training on N-1 and testing on the remaining one. That works for IID data but financial returns aren't IID — they have time structure. K-fold leaks information from the future into the training set. Walk-forward respects time ordering: train only on data older than the test period. For prediction markets, always use walk-forward.
The Bottom Line
Your backtest is lying to you in five specific ways:
- Selection bias: trying 100 variants and picking the best ≠ finding a strategy
- Fill assumptions: backtests use mid-quote, live crosses the spread
- Regime fragility: October 2025 crypto crash, election surprises, news events break models
- Liquidity assumptions: Polymarket Kyle's lambda swings 50x between calm and active markets
- Lookahead leakage: especially with k-fold cross-validation on time-series data
The defense isn't to stop backtesting. It's to put every strategy through the gauntlet: walk-forward → Deflated Sharpe → out-of-sample PBO → paper → canary → scale. Each filter catches a different failure mode. Most retail strategies fail step 1; most surviving strategies fail step 4. The ones that make it through tend to actually work.
If you're building strategies on Kalshi or Polymarket, start with Turbine Studio — backtests, assumption review, and deployment controls are built into the workflow. If you're rolling your own, build the pipeline before you build the strategy. The infrastructure work is boring. It's also the only thing that separates traders who make money from traders who just had a good backtest.
This article is for educational purposes only. Trading prediction markets and automated strategies involves substantial risk of loss. Past performance does not guarantee future results. Always validate strategies in paper trading before risking real capital.