How to Test a Prediction Market Strategy Without Losing Capital (Paper Trading Guide 2026)
A backtested Sharpe ratio of 2.0 typically degrades to 1.0-1.5 in live trading — a 25-50% haircut from slippage, fills, and regime exposure (Breaking Alpha, citing Bailey & López de Prado). Live drawdowns run 1.5-2x larger than backtest drawdowns. Over 90% of academic trading strategies fail when implemented with real capital (Diversification.com, 2026). A study of 8 million retail traders over 27 years found 74-89% end net negative (Hedge Fund Alpha, 2025).
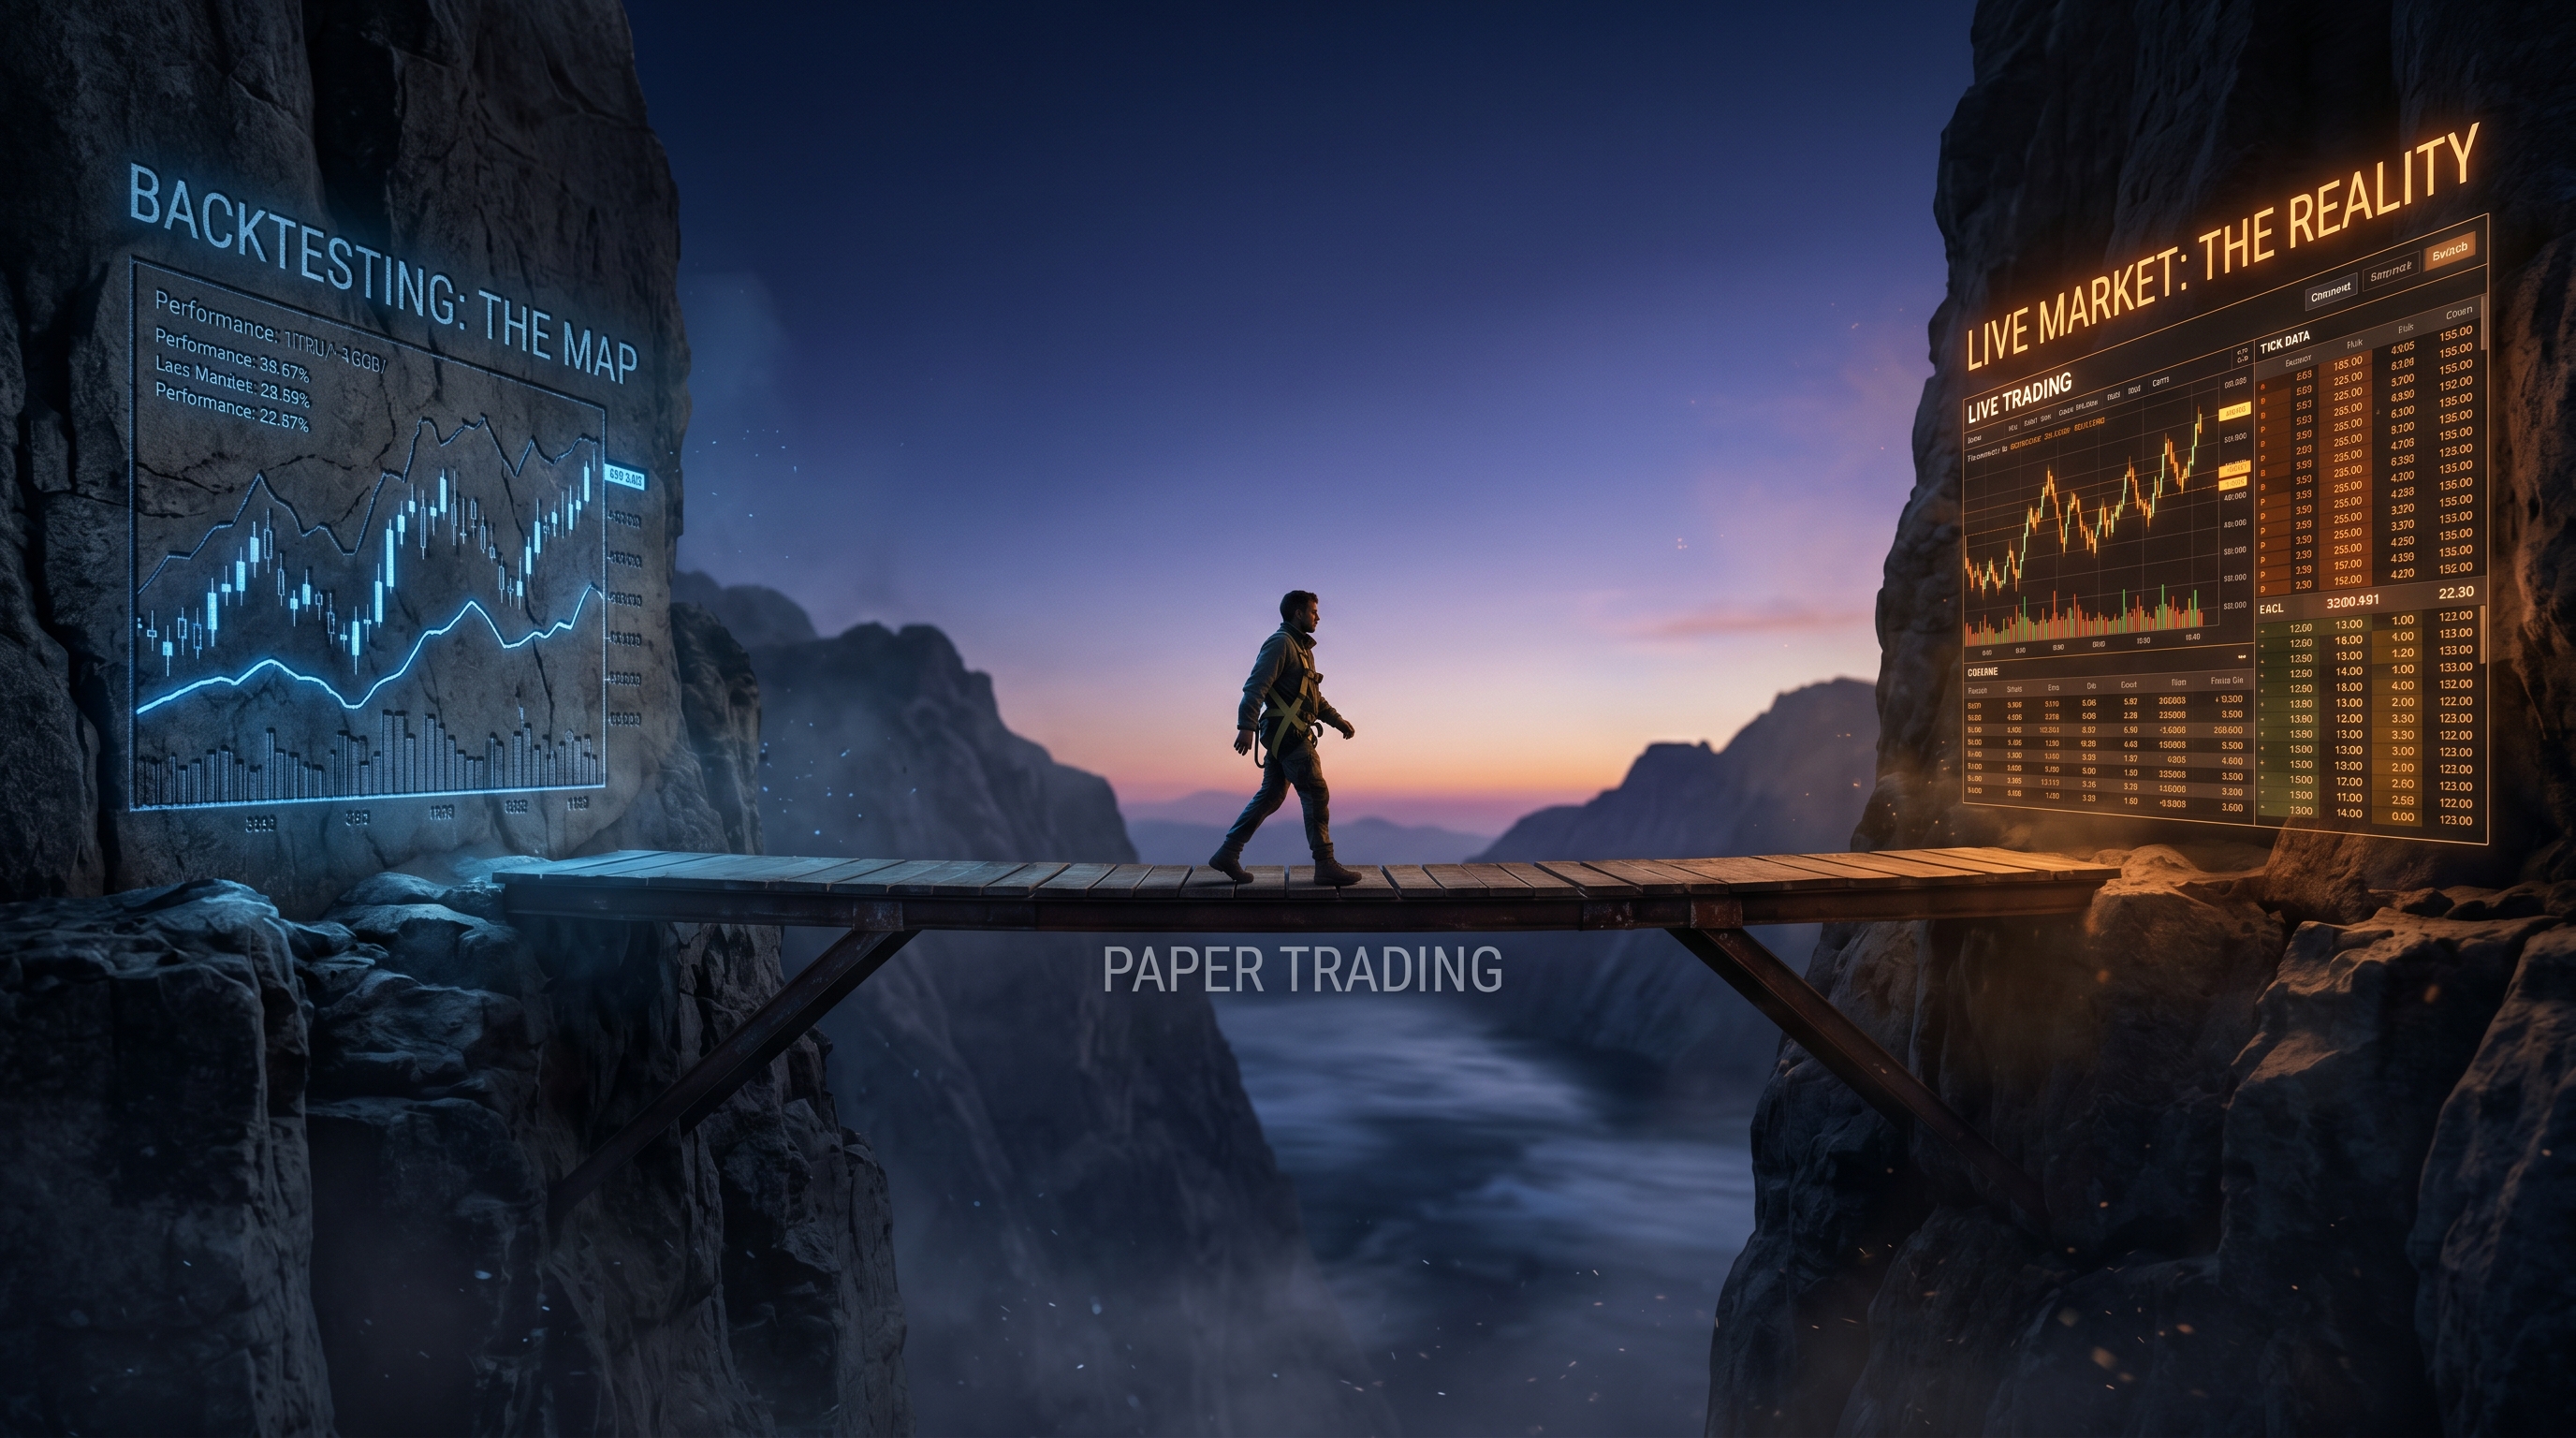
Paper trading is the cheapest insurance you can buy against being in that 90%. It's the bridge between historical backtest and live deployment — you run the strategy on live data feeds with no real money, catch the gap between your assumptions and reality, then promote to canary. Most retail traders skip it. Pros don't. Here's the tactical guide: what paper trading actually catches (and misses), the platforms that work in 2026 — including Kalshi's official demo environment and Polymarket's testnet workarounds — and the graduation criteria for moving from paper to live.
**Key Takeaways** - Kalshi has an official demo environment at `demo-api.kalshi.co` with full feature parity and 0% fees — separate credentials from production ([Kalshi Docs](https://docs.kalshi.com/getting_started/demo_env)) - Polymarket has no testnet — paper trading requires a custom fill simulator over live WebSocket data, or $1 Fill-Or-Kill orders on mainnet for connectivity testing ([Chainstack](https://chainstack.com/polymarket-api-for-developers/)) - Recommended paper trading duration: **2-4 weeks minimum, 60-100 trades** for high-frequency strategies; 6-12 months for swing strategies ([Trading Heroes](https://www.tradingheroes.com/how-long-should-i-paper-trade/)) - Graduation criteria: paper Sharpe > 1.5 (to absorb the ~25-50% live haircut), paper drawdown < 1/2 of acceptable live drawdown, multi-regime exposure verified
What Paper Trading Actually Tests (And Doesn't)
Paper trading and backtesting solve different problems. Knowing the difference saves you from over-relying on either.
Backtesting tells you: Does the strategy logic produce returns on historical data?
Paper trading tells you: Does the strategy survive contact with live data streams — real WebSocket disconnects, real news pulses, real orderbook shape?
Paper trading does NOT tell you: What happens when real money creates real market impact. Your $50K position in a thin Kalshi single-name market moves the price. Paper trading assumes you don't.
The Sharpe-degradation chain is well-documented:
The implication: if you want a profitable live strategy with SR ≥ 1.0, you need paper SR ≥ 1.5. Anything less, and your live equity curve is statistically indistinguishable from random.
For deeper context on why backtests over-promise, see our overfitting playbook from May 9 — it covers Deflated Sharpe Ratio, walk-forward validation, and Probability of Backtest Overfitting.
The 3 Paper Trading Paths on Prediction Markets
In 2026, there are exactly three viable ways to paper trade Kalshi or Polymarket strategies. They trade fidelity, speed, and effort differently.
Path 1: Kalshi Demo Environment (Recommended for Kalshi)
Kalshi maintains an official demo environment with full feature parity to production:
- REST endpoint:
https://demo-api.kalshi.co/trade-api/v2 - WebSocket endpoint:
wss://demo-api.kalshi.co/trade-api/ws/v2 - Credentials: Separate from production — sign up at
demo.kalshi.co(Kalshi Docs) - Fees: 0%, matching Kalshi's 2026 production fee structure (AgentBets Kalshi Guide)
- Funding: Not preloaded — you have to add mock funds via test payment methods (Kalshi Help Center)
The caveat: Demo liquidity is thinner than production. Your fills will look optimistic compared to the real book. Use demo for connectivity testing, strategy logic validation, and order-flow plumbing — but don't trust the fill quality as a proxy for production.
Path 2: Polymarket Mainnet with $1 FOK Orders (Polymarket Workaround)
Polymarket has no testnet. All development happens on Polygon mainnet (chain 137) with real USDC.e (Chainstack, 2026). The standard workaround for "paper-like" testing:
Use Fill-Or-Kill (FOK) or Fill-And-Kill (FAK) orders at $1 minimum size. These orders execute immediately or cancel — they never rest on the book, so they don't expose you to extended risk:
- FOK = full immediate execution or cancel entirely
- FAK = partial fill OK, cancel the remainder (IOC semantics)
The batch order endpoint accepts a max of 15 orders per request (Polymarket agent-skills). This lets you validate auth, signing, and execution paths with minimal capital at risk.
The caveat: This isn't true paper trading — it's small-money live trading. You'll lose roughly $0.50-2.00 per order to spreads and gas. For a 60-trade validation run, budget ~$60-120 in actual losses.
Path 3: Custom Fill Simulator on Live WebSocket (Most Realistic)
For both platforms, the highest-fidelity paper trading is a custom simulator. Subscribe to the live WebSocket feed, maintain a virtual portfolio, and simulate fills using realistic execution assumptions:
- Subscribe to
orderbook_deltaevents - Maintain a virtual book + virtual cash balance
- On strategy signal, simulate the cross-the-spread fill (NOT mid-quote — that's optimistic fill bias)
- Apply slippage: ~1-2% for liquid markets, 5%+ for illiquid (LuxAlgo)
- Track timestamp deltas between signal and simulated fill (latency simulation)
This is what most quant teams use. The work upfront is real (probably 2-3 days of engineering), but the fidelity is the highest available short of canary deployment. The WebSocket and historical replay endpoints needed to build it are covered in our historical data sources guide.
Third-Party Tools That Skip the ETL
If you don't want to build a simulator from scratch, two third-party tools cover both Kalshi and Polymarket:
| Tool | Virtual Balance | Coverage | Notes |
|---|---|---|---|
| PolySimulator | $1,000 | Kalshi + Polymarket | No KYC, no wallet required |
| Oddpool | $10,000 | Kalshi + Polymarket | Live P&L tracking |
Both are appropriate for retail validation. Neither matches the fidelity of a custom simulator.
**Decision framework:** - **Trading Kalshi only?** Use the Kalshi Demo environment. Free, full API parity, the natural choice. - **Trading Polymarket only?** Build a custom WebSocket simulator OR use PolySimulator for quick validation. Mainnet $1 FOK is the third option. - **Trading both?** Custom simulator with shared portfolio model. This is also where Turbine Studio's free preview shines — both platforms in one validation surface.
Common Paper Trading Mistakes
Five mistakes that turn paper success into live failure:
1. Look-ahead bias in paper trading. This sounds impossible (live data is live data) but it happens. Using the same-bar close to make a decision that should have used the open, or calculating an indicator with bars that wouldn't have been available at the decision time, leaks future data. The Quantreo guide on look-ahead bias is the cleanest treatment of this in 2026 (Quantreo).
2. Optimistic mid-quote fills. Your simulator marks every fill at the mid-quote. Live trading crosses the spread. The difference compounds. On a 50-cent Kalshi contract with a 2-cent spread, mid-quote vs taker-side is a 2% per-trade hit. Over 100 trades that's a 200% drag.
3. Ignoring fees. Kalshi charges 0% in 2026 (AgentBets) so this matters less on Kalshi. Polymarket has Polygon gas costs ($0.01 to $2.00 per trade depending on congestion) and USDC.e movement frictions. We covered the full fee math in our affordable bots post.
4. Insufficient duration. Most retail traders paper-trade for a few days, decide "it works," and deploy. Professional minimum is 60-100 trades or 4 weeks, whichever is later (Skyriss). For swing strategies that fire less often, 6-12 months ensures multi-regime exposure (Trading Heroes).
5. Treating paper success as deployment-ready. Even successful paper trading has the ~25-50% Sharpe haircut waiting. The institutional rule: require paper Sharpe ≥ 1.5 to feel confident about a live Sharpe ≥ 1.0. Paper SR 1.2 is not "good enough" — it's "expected to lose money live."
The Bridge: Paper → Canary → Full Live
Paper trading isn't the finish line. It's the second stage in a four-stage deployment pipeline:
Graduation criteria from paper to Canary 1:
- Minimum 60-100 trades OR 4 weeks of paper trading (whichever comes later)
- Paper Sharpe ratio > 1.5 (to absorb the live haircut)
- Maximum drawdown in paper < 1/2 of your tolerable live drawdown
- At least one news/macro event experienced during the paper window
- Fill realism audit: less than 20% of paper fills should have been at mid-quote
Graduation criteria from Canary to Full:
- Canary live performance tracks paper within tolerance (Sharpe within 0.3, drawdown within 1.5x)
- No execution incidents (failed orders, websocket disconnects without recovery, partial fills handled wrong)
- 2-4 weeks at each canary stage minimum
For the full systematic framework that paper trading fits into, see our quant playbook from May 15 — signal → sizing → risk → validation → deployment.
Why Skipping Paper Trading Is Expensive
Three case studies in what happens when teams skip the paper-trade-then-canary discipline:
Knight Capital, August 2012. A dormant code path ("Power Peg") was activated on 1 of 8 servers during a production deployment. In 45 minutes, Knight executed 4 million orders across 154 stocks and lost $440 million (Henrico Dolfing case study). The strategy was fine. The deployment skipped paper-trade canary verification.
LTCM, August 1998. Long-Term Capital Management lost ~$500 million per day in mark-to-market during the Russian default (Berkeley). Their VaR models were built on a short history that excluded prior crises. Paper trading on a longer window would have surfaced the regime fragility before the live blowup.
The retail equivalent: A 2025 study of 8 million retail trader profiles across 295 million trades over 27 years found 74-89% end net negative (Hedge Fund Alpha). Most never paper-traded systematically. Most deployed strategies that hadn't survived even basic forward testing.
You're not running Knight Capital's infrastructure. But the failure mode — deploying untested code or untested strategies into live markets — is identical.
What This Looks Like in Turbine Studio
[PERSONAL EXPERIENCE] Turbine Studio's free preview is structured exactly as a paper-trading sandbox. You build a strategy, backtest it against historical Kalshi data, then promote to a paper-trading deployment that runs the same strategy logic against live data — with no real capital at risk.
The Studio deployment workflow forces you through paper → canary → full live with explicit promotion gates. You can't skip to Canary 2 until Canary 1 metrics pass. You can't promote to full live until the system has verified paper and canary track within tolerance. This is the same workflow Renaissance, Two Sigma, and AQR use internally — packaged so retail traders can use it without rebuilding it.
The DIY path is fully viable — every method in this post is buildable from scratch in Python over a weekend. The value of the Studio path is skipping the infrastructure work and getting straight to strategy iteration. See Turbine Studio plans.
Frequently Asked Questions
How long should I paper trade before going live?
The professional minimum is 60-100 trades OR 4 weeks of paper trading, whichever comes later (Skyriss). For high-frequency Kalshi strategies, you'll hit 100 trades in days. For swing strategies on weekly markets, you need 6-12 months to get enough samples plus multi-regime exposure (Trading Heroes).
Is Kalshi's demo environment really identical to production?
Feature parity yes — same endpoints, same auth flow, same order types, 0% fees in both (Kalshi Docs). Liquidity, no — demo books are thinner than production, so your fills will look more optimistic in demo. Don't use demo fill rates as a deployment proxy.
What's the minimum paper Sharpe needed to deploy live?
The institutional rule of thumb: paper Sharpe > 1.5 to expect a live Sharpe > 1.0, given the typical 25-50% live haircut (Breaking Alpha). Paper Sharpe of 1.2 is below the bar — expected live result is roughly break-even to slightly negative.
Can I paper trade Polymarket without writing code?
Yes — PolySimulator gives you a $1K virtual balance covering Polymarket, no KYC and no wallet required. Oddpool gives $10K with live P&L tracking. Neither matches the fidelity of a custom WebSocket simulator, but both are appropriate for retail validation.
What's the cheapest way to validate a strategy that trades both Kalshi and Polymarket?
Kalshi Demo (free, full feature parity) + Polymarket custom WebSocket simulator (free if you build it). Total cost: $0 plus engineering time. If you want a turn-key solution that covers both platforms with shared portfolio accounting, that's the value proposition of Turbine Studio's free preview — both surfaces in one paper-trading environment.
The Bottom Line
Paper trading isn't optional. It's the only stage in the systematic workflow that catches the gap between backtest assumptions and live execution before real money is at risk:
- Kalshi Demo at
demo-api.kalshi.cois free and full-fidelity for API testing - Polymarket has no testnet — use a custom WebSocket simulator, or $1 FOK orders on mainnet, or PolySimulator / Oddpool
- Minimum paper trading duration: 60-100 trades or 4 weeks, whichever later
- Graduation criteria: paper Sharpe > 1.5, paper DD < 1/2 acceptable live DD, multi-regime exposure
- Then bridge to canary: 1-5% capital first, scale through 10% → 25% → 100% with 2-4 weeks at each stage
The 74-89% of retail traders who lose money mostly skip this entire workflow. The path to being in the other 11-26%: do the boring validation work before deploying. Start with Turbine Studio's free preview if you want the pipeline packaged. Build it from scratch in Python if you want full control. Just don't deploy strategies straight from backtest to live capital — that's how 90% of academic strategies end up in the failure column.
This article is for educational purposes only. Trading prediction markets involves substantial risk of loss. Paper trading does not guarantee live performance. Always paper trade long enough to experience multiple market regimes before deploying real capital.