Parameter Sweeps and Permutation Testing: How Turbine Deep Research Stress-Tests Your Strategy
 Ryan Bajollari
Test 100 strategy variants and you're ~99.4% likely to find a false positive. How Turbine's parameter sweeps and permutation tests catch it.

Run 100 independent tests at the standard 5% significance level and the probability of at least one false positive is about 99.4% (Multiple comparisons problem, Wikipedia). Every Turbine Deep Research run backtests exactly 100 strategy variants. So by construction, the "winner" of a research run could be pure luck — unless you test for it.
That's why we added two statistical stress tests to every Deep Research report: a Parameter Sensitivity sweep and a Permutation Test. Together they answer the two questions a backtest alone can't: is the winning result robust to small parameter changes, and could random noise have produced it anyway?
This post explains what each test does, the math behind it, and how to read the results on your own reports. Turbine is, as far as we know, the first prediction-market platform to run Monte Carlo permutation testing automatically on every research report.
Key Takeaways
- Testing many parameter combos guarantees impressive-looking losers: 20 comparisons already carry a ~64% false-positive chance (Ranganathan et al., 2016)
- Turbine's Parameter Sensitivity sweep reruns your thesis across nearby parameter values and reports a Deflated Sharpe Ratio per Bailey & López de Prado (SSRN, 2014)
- The Permutation Test re-runs your entire parameter grid against 1,000 shuffled copies of the market data and reports a p-value
- p ≤ 0.05 means fewer than 5% of luck-only re-sweeps beat your real result
Why Backtests Alone Aren't Enough
Backtested strategies degrade out-of-sample — reliably. McLean and Pontiff tracked 97 published return predictors and found returns fall 26% out-of-sample and 58% after publication (McLean & Pontiff, Journal of Finance, 2016). A study in Quantitative Finance found the Sharpe decay of newly published factors accelerates by 5 percentage points per year of publication recency (Falck, Rej & Thesmar, 2022).
The main culprit is selection. Harvey, Liu, and Zhu argued that "most claimed research findings in financial economics are likely false," and that once you account for multiple testing, a new result needs a t-statistic above 3.0 — not the usual 2.0 (Harvey, Liu & Zhu, NBER, 2016).
We covered the failure modes in depth in Why Your Backtest Said +20% But Live Trading Lost Money. This post is about the fix: what we built into Deep Research to catch it automatically.
What a Turbine Deep Research Run Actually Does
Quick recap for context. You submit a thesis — a plain-English trading idea like "fade panic dumps in Kalshi BTC hourly markets." Deep Research turns it into a base strategy, generates exactly 100 variants by varying its parameters, and backtests every one against historical market data. See Getting Started with Turbine Studio for the full flow.
The report ranks the variants and shows you the winner. That's exactly the setup where selection bias thrives — 100 trials, keep the best. So the report now runs two more stages before it reaches your inbox.
The Parameter Sensitivity Sweep: Is the Winner Robust or Isolated?
The Parameter Sensitivity section reruns the same thesis across nearby parameter values to show whether the winner is robust or isolated. The sweep is strategy-aware: it picks the parameters that actually drive the signal for your strategy type. A momentum thesis sweeps its momentum threshold; a mean-reversion thesis sweeps its entry band; a panic-fade thesis sweeps its panic threshold. Sizing and cadence parameters stay anchored so the sweep isolates signal behavior.
Each cell in the grid is a full backtest at one parameter combination. The report renders the results three ways:
- Parameter Heatmap — a 2-D grid colored by Net PnL (or Sharpe), with failed cells shown as holes. A healthy strategy shows a broad plateau of profitable cells. A lone bright cell surrounded by losses is a red flag.
- Marginal Response — line charts showing how the metric moves as each parameter varies on its own.
- Caveats — automated warnings on the winner (more below).
The Deflated Sharpe Ratio
The headline statistic is the Deflated Sharpe, based on Bailey and López de Prado's 2014 method (SSRN, 2014). The intuition: even with zero skill, the best of N random trials shows an inflated Sharpe — and the expected maximum grows with N (Bailey et al., "Pseudo-Mathematics and Financial Charlatanism", Notices of the AMS, 2014).
So the report computes the Sharpe that pure noise would produce across as many trials as your sweep ran cells — the noise ceiling — and asks whether your winner clears it, adjusting for the skew and kurtosis of its daily returns. The result is a probability.
How to read it: A Deflated Sharpe of 0.99 means there's a 99% probability your winner's edge beats the best-of-N noise ceiling. Below 0.95, the report flags it: the winner is not distinguishable from the luckiest of the sweep's skill-less trials. We count every cell as an independent trial, which is deliberately conservative — neighboring cells are correlated.
Automated caveats
Every winner also gets screened against a versioned set of robustness checks. The report warns you when:
- Fewer than 30 resolved trades back the result (metrics statistically unreliable)
- Fewer than 10 distinct PnL days exist (daily Sharpe rests on too few observations)
- A single trade contributes over 40% of PnL — or removing the largest trade flips the sign entirely
- Fees eat more than 50% of gross PnL
- Over 30% of fills happen at extreme prices, where fill assumptions are least trustworthy
These thresholds echo the standard advice from the Probability of Backtest Overfitting literature: track your trials and discount accordingly (Bailey, Borwein, López de Prado & Zhu, 2015).
The Permutation Test: Could Luck Alone Have Done This?
The sweep tells you the winner is stable across parameters. It can't tell you whether the whole grid got lucky on this particular slice of history. That's what the Permutation Test is for.
The idea comes from Monte Carlo permutation testing (MCPT), popularized for trading systems by Timothy Masters. His argument: most reported backtest results are statistically meaningless because nobody computes a chance baseline (Masters, MCPT primer, 2006). The approach is a close cousin of White's Reality Check, the classic bootstrap method for testing whether the best of many strategies beats a benchmark after accounting for data snooping (White, Econometrica, 2000).
Permute-then-re-sweep
Here's what happens under the hood.
- The report captures the exact market data the winning backtest saw.
- It creates a shuffled copy: within each market, bar-to-bar returns are block-shuffled in logit space, preserving each bar's intrabar shape and the series' final price. The timestamps and settlement outcomes stay fixed. The result is a market with the same overall drift and texture — but no exploitable structure.
- It re-runs the entire parameter sweep — every cell — against that shuffled world, and records the best result any cell achieved.
- Repeat 1,000 times.
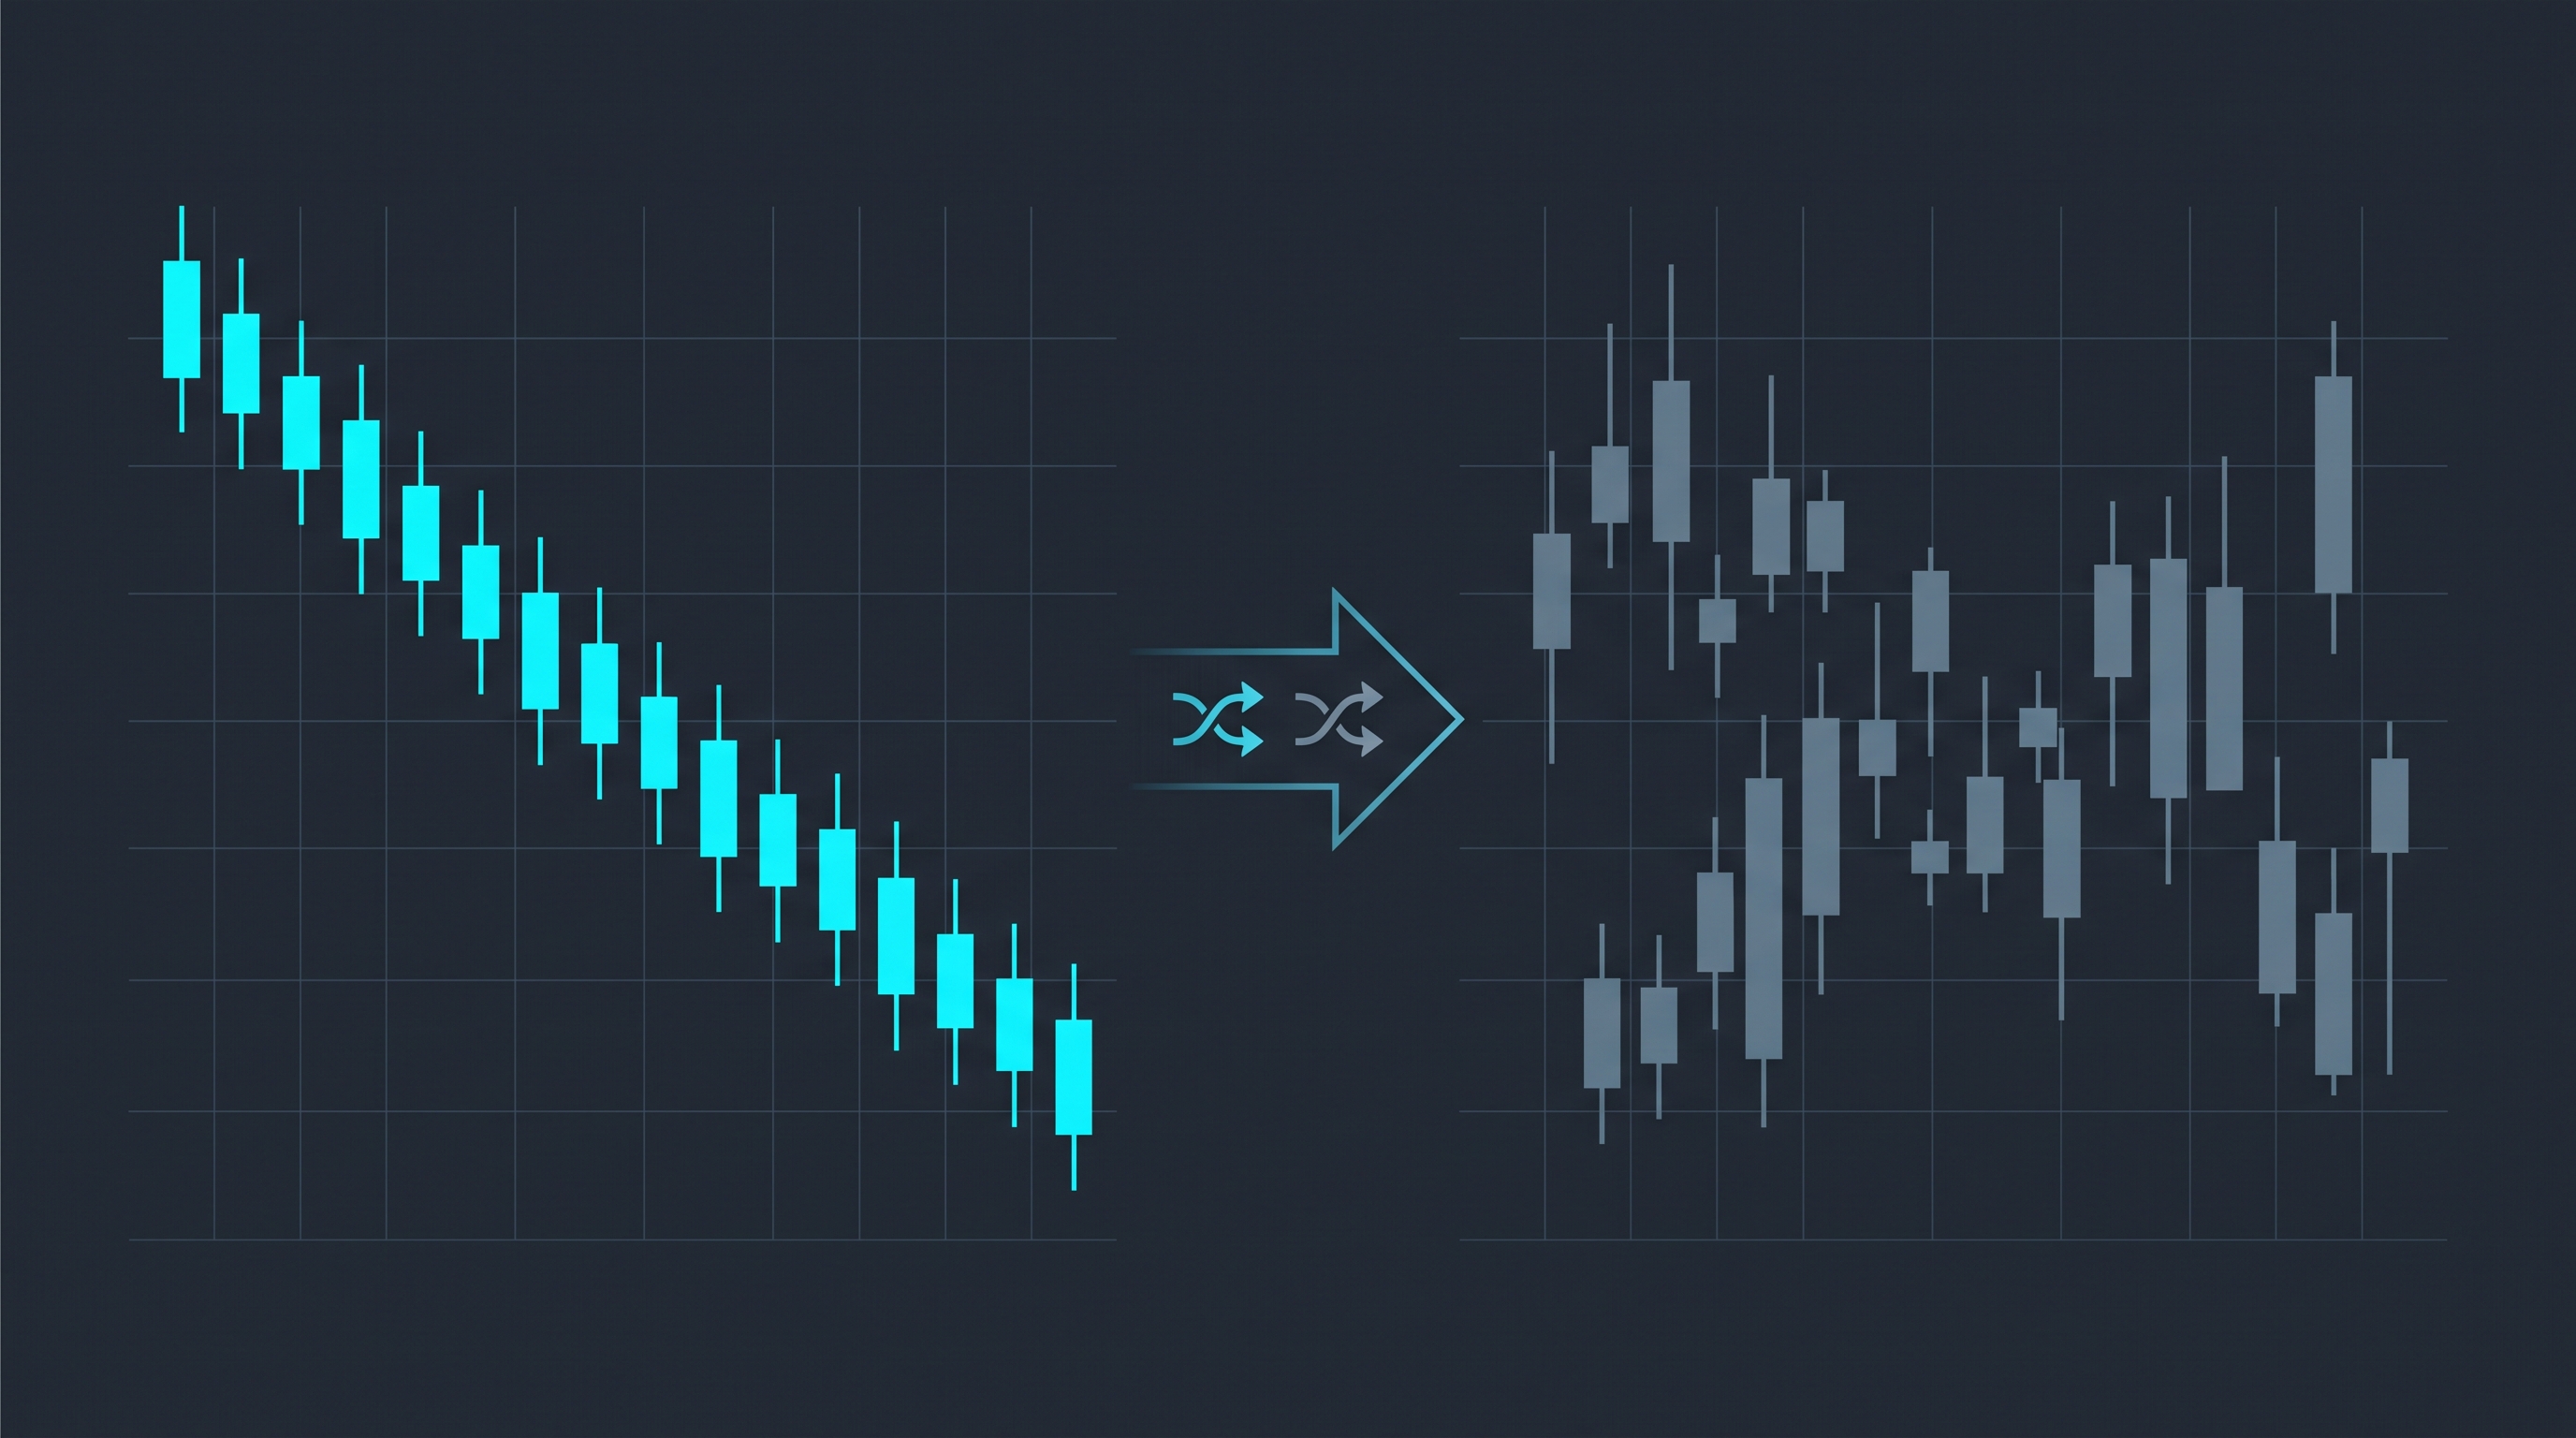
That last detail matters. Comparing your winner against a single shuffled backtest would be too easy to beat. Comparing it against the best of the whole grid on each shuffle reproduces exactly the selection process that found your winner. The null hypothesis is "the best result achievable by luck across the whole grid," which is the honest baseline.
The report then shows a histogram labeled Luck-Only Re-Sweeps with a dashed Real Winner marker, and a p-value: the fraction of luck-only re-sweeps that matched or beat the real result.
Reading the p-value
The report translates the p-value into plain language:
- p ≤ 0.05 — results like this rarely arise by chance; the strategy is likely exploiting real structure
- p ≤ 0.20 — inconclusive; treat the edge as unproven
- p > 0.20 — not distinguishable from luck
There's also a lower-tail check: if the real result is unusually weak compared to random shuffles, that usually signals a backtest artifact rather than a bad strategy — worth investigating either way.
Two implementation notes for the statistically curious. First, the permutation scheme adapts to the strategy: panic-fade theses shuffle in ~30-bar blocks to preserve volatility clustering, and theses driven by an external edge feed scramble the edge data's timing instead of prices (the report says so explicitly when it does). Second, the p-value uses the standard (1 + k) / (N + 1) estimator, and the shuffle seed is derived from the report ID, so reruns reproduce the same p-value.
What These Tests Don't Do
A passing sweep and a p-value of 0.02 don't guarantee live profits. Permutation tests validate against the same historical window — they can't see regime changes, liquidity droughts, or news shocks that never happened in your data. Fill assumptions still matter, which is why the caveats flag extreme-price fills separately.
Think of the pipeline as filters, not oracles: the backtest finds candidates, the sweep kills isolated flukes, the permutation test kills lucky grids, and paper trading catches what history can't. Position sizing still decides whether a real edge survives contact with variance — see our position sizing guide.
Why This Matters More As Prediction Markets Grow
Combined Kalshi and Polymarket monthly volume grew from under $5 billion in September 2025 to roughly $24 billion by April 2026 (Pew Research Center, 2026). More volume means more strategies, more competition, and faster decay of any edge that becomes widely known — the same crowding dynamic documented in the strategy-decay literature cited above.
In that environment, the traders who survive are the ones who kill their own bad ideas before the market does it for them. That's the whole point of building these tests into the default research flow rather than leaving them as an optional extra.
Run Your Own Deep Research Report
Every Deep Research run on Turbine now includes the Parameter Sensitivity sweep and Permutation Test automatically — no configuration, no statistics degree required. Submit a thesis, get back 100 backtested variants, a robustness heatmap, a Deflated Sharpe, and a luck baseline from 1,000 shuffled worlds.
FAQ
What is a parameter sensitivity sweep?
A parameter sweep reruns a trading strategy across a grid of nearby parameter values, backtesting each combination. If profits only appear at one precise setting, the result is likely curve-fit. Turbine sweeps the signal-driving parameters per strategy type and visualizes results as a heatmap with a Deflated Sharpe Ratio.
What is a permutation test in trading?
A permutation test shuffles historical market data to destroy any real pattern while preserving its statistical texture, then re-runs the strategy on many shuffled copies. If the real result rarely beats the shuffled ones, the strategy likely found real structure. The approach was popularized by Timothy Masters (MCPT primer, 2006).
What is the Deflated Sharpe Ratio?
The Deflated Sharpe Ratio, from Bailey and López de Prado (SSRN, 2014), corrects a backtested Sharpe for having been selected as the best of many trials, and for non-normal returns. It's expressed as a probability that the edge beats the best-of-N noise ceiling; Turbine flags anything below 0.95.
What p-value should I look for?
Turbine's reports treat p ≤ 0.05 as evidence of real structure, p ≤ 0.20 as inconclusive, and anything above as indistinguishable from luck. With 1,000 permutations, a p-value of 0.05 means only about 50 luck-only re-sweeps matched or beat your real result.
Does a passing permutation test guarantee live profits?
No. It validates against the same historical window, so it can't anticipate regime changes or liquidity shocks. It removes the most common failure — mistaking selection luck for edge — but paper trading and sane position sizing remain essential before deploying capital.
Conclusion
- Backtesting 100 variants virtually guarantees a lucky-looking winner; returns of published strategies drop 26% out-of-sample and 58% post-publication
- Turbine's Parameter Sensitivity sweep shows whether your winner sits on a robust plateau or an isolated spike, and deflates its Sharpe for selection bias
- The Permutation Test re-runs your full parameter grid against 1,000 shuffled worlds and reports the honest probability luck explains your result
- Both run automatically on every Deep Research report — read the Caveats panel before you deploy anything
This content is for informational purposes only and is not financial advice. Prediction market trading involves risk of loss. Backtested and simulated results do not guarantee future performance. Trade responsibly.