Why Your Prediction Market Bot Wins in Calm Markets But Dies in Volatility (And How to Fix It)
 Ryan Bajollari
In Oct 2025, visible BTC liquidity collapsed 99.8% and spreads widened 1,321x in 40 minutes. Here's why bots die in volatility, and the vol-adjusted sizing math that survives it.
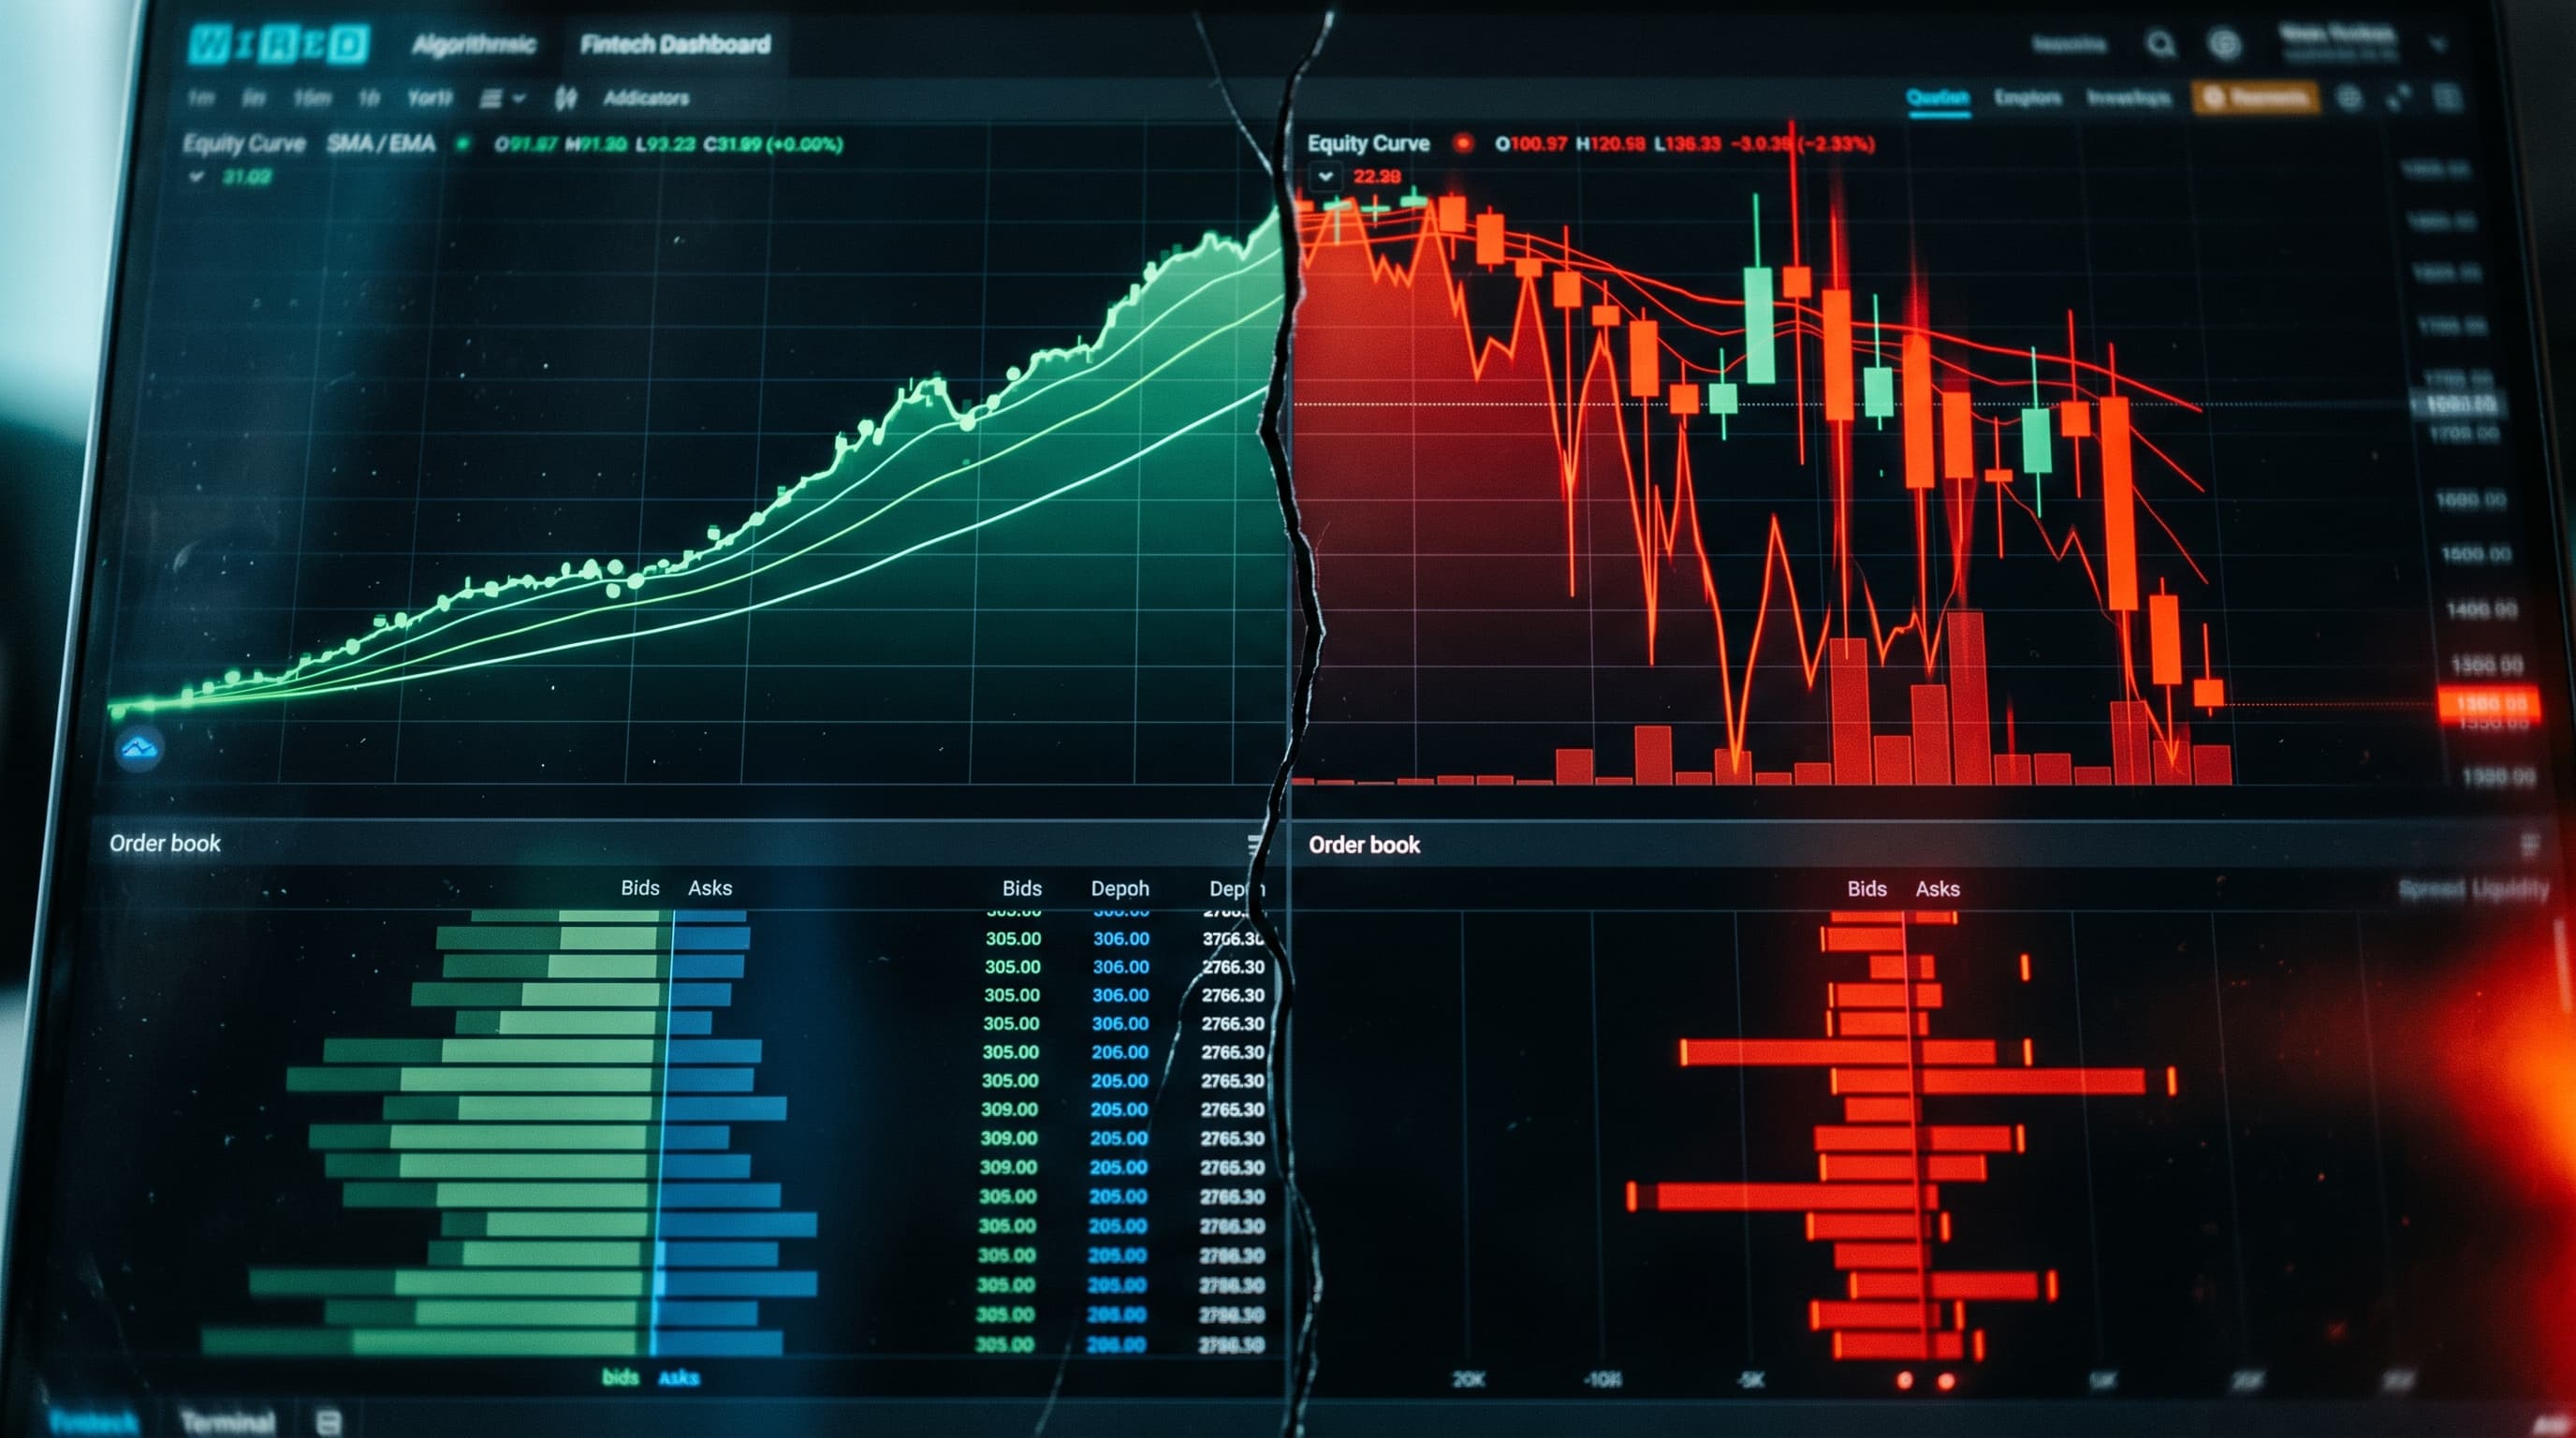
On October 10, 2025, visible Bitcoin liquidity on perpetual exchanges collapsed from $103.64 million to $0.17 million — a 99.8% evaporation. In the same 40-minute window, the BTC bid-ask spread widened from 0.02 basis points to 26.43 basis points: 1,321 times wider. The liquidation rate accelerated 86x, from $0.12 billion an hour to $10.39 billion an hour (Amberdata, Oct 2025).
If your Kalshi or Polymarket bot printed money for months and then gave it all back in a single afternoon, you didn't get unlucky. You hit a volatility regime your strategy was never built for. Calm markets reward the exact behaviors — tight quoting, fixed position sizes, mean-reversion — that get punished the instant volatility spikes. Our earlier post on why backtests lie named regime change as one cause of overfitting among many. This one goes deep on just that: how liquidity vanishes, why fixed-fraction sizing blows up, and the volatility-adjusted math that survives a crash.
Key Takeaways
- Visible BTC liquidity collapsed 99.8% ($103.64M → $0.17M) and spreads widened 1,321x in 40 minutes during the Oct 2025 crash (Amberdata, 2025)
- Full-Kelly sizing carries a 50% chance of a 50% drawdown; half-Kelly cuts that to 12.5% while sacrificing only
25% of growth ([MacLean, Thorp & Ziemba](https://www.stat.berkeley.edu/aldous/157/Papers/Good_Bad_Kelly.pdf), 2010)- Volatility targeting cut max drawdown from 40% to 25% and tripled the return-to-drawdown ratio (Man Group, 2018)
- Bitcoin's GARCH volatility persistence is 0.9844 — near-unity — which is the mathematical reason high-vol periods cluster and a calm-market bot keeps trading straight into the storm (NYU V-Lab, 2026)
Why Bots Win in Calm Markets and Die in Volatility
The short answer: a calm market is a different market. Your bot wasn't trained to trade volatility — it was trained to trade the absence of it.
In calm conditions, order books are deep, spreads are tight, and prices mean-revert. A market-making or mean-reversion bot quotes both sides, collects the spread, and rarely gets run over. Fixed position sizes feel safe because daily moves are small. The backtest looks gorgeous because the historical sample was mostly calm — most months are.
Then volatility arrives. Liquidity providers pull their quotes, the book thins out, and the same fixed-size order that used to cost pennies now moves the price by points. Mean reversion stops working because the move isn't noise — it's a regime change. Your bot keeps doing the one thing it knows how to do, into a market that no longer rewards it.
The cruelty is that volatility clusters. Bitcoin's GARCH(1,1) persistence parameter sits at 0.9844 — almost exactly one (NYU Stern V-Lab, 2026). A persistence that close to unity means a volatility shock decays slowly: high vol today predicts high vol tomorrow, and the day after. A peer-reviewed crypto survey found volatility clusters can persist for months in crypto versus days or weeks in equities (RAUSP Management Journal, 2025). So a bot that survives the first hour of a crash doesn't get to relax — it keeps bleeding until the regime actually breaks.
The core failure mode: A calm-market bot optimizes for the 90% of days that are quiet and ignores the 10% that decide your annual P&L. Volatility clustering guarantees those 10% arrive in bunches, not one at a time. If your sizing and quoting don't change when the regime changes, you've built a strategy that's structurally designed to give back its gains.
How Liquidity Disappears: The October 2025 Crypto Crash
The October 10-11, 2025 crash is the cleanest recent autopsy of liquidity evaporation. In about 14 hours, roughly $19 billion in leveraged crypto positions were liquidated, with $3.21 billion wiped out in a single minute at 21:15 UTC. Eighty-seven percent of the liquidated value was on the long side (FTI Consulting, Oct 2025). Aggregated exchange data put the human cost at roughly 1.6 million traders liquidated and about $370 billion erased from total crypto market cap (CryptoRank, Oct 2025).
But the number that matters for bot survival isn't the dollar figure — it's the order-book collapse. Amberdata's tick-level reconstruction shows visible BTC top-of-book liquidity fell from $103.64 million to $0.17 million, total open interest evaporated $36.71 billion (−25.03%), and BTC five-minute realized volatility spiked 20x, from 0.14% to 2.82% (Amberdata, Oct 2025). FTI confirmed top-of-book depth shrank more than 90% on key venues, with spreads jumping from single-digit basis points to double-digit percentages (FTI Consulting, Oct 2025).
Now translate that to a prediction market. Kalshi and Polymarket order books are thinner than crypto perps in calm conditions, and they're driven by discrete information events — a Fed decision, an election call, a sports resolution. When one of those events lands, the makers pull quotes exactly like the perp desks did in October. A bot quoting both sides of a Kalshi contract during a fast resolution is paying that 1,321x spread tax on every fill it can't cancel in time. That's the same adverse-selection mechanism we documented in why your trades get picked off, amplified by a volatility spike.
Why Fixed-Fraction Sizing Blows Up in Regime Change
Most retail bots use fixed-fraction sizing: bet a constant percentage of the bankroll, or worse, a constant dollar amount. In a calm regime that's fine. In a regime change it's a detonator.
Here's the math. The Kelly criterion tells you the bet size that maximizes long-run growth. But the well-known Kelly drawdown property is brutal: under full-Kelly sizing, the probability of your bankroll ever dropping to a fraction x of its peak is exactly x. So full Kelly carries a 50% probability of a 50% drawdown at some point. Half-Kelly cuts that probability to 12.5% while reducing your long-run growth rate by only about 25% (MacLean, Thorp & Ziemba, 2010). An empirical backtest on a single equity confirmed the shape: full Kelly produced a 48.4% max drawdown versus 25% for half-Kelly (Carta & Conversano, Frontiers, 2020).
But the deeper problem with fixed-fraction sizing is that it ignores volatility entirely. Your edge per trade is roughly constant, but your risk per trade scales with volatility. When realized vol spikes 20x — as BTC's did in October — a fixed-fraction bet that risked 1% of bankroll in calm conditions is suddenly risking the equivalent of 20%. You didn't change your bet. The market changed how much that bet costs you. Fixed-fraction sizing is really "fixed in dollars, exploding in risk."
This is the volatility-specific gap the overfitting post only gestured at. Overfitting is about a fake edge. Regime failure is about a real edge sized wrong for the conditions.
The Math of Volatility-Adjusted Kelly Sizing
The fix is to make position size inversely proportional to volatility, so risk stays constant even as conditions change. This is called volatility targeting, and it's the single most-tested risk control in quant finance.
The mechanic is simple. Pick a target risk level — say, a constant volatility budget. Estimate current volatility from a trailing window. Then scale your position by target_vol / current_vol. When volatility doubles, you halve your size. AQR's published implementation targets 10% annualized volatility and uses a 63-day trailing realized-vol estimate as the forecast (AQR, 2019). For a faster-moving prediction-market bot you'd use a shorter window, but the formula is identical.
Combine that with fractional Kelly and you get volatility-adjusted Kelly: compute the Kelly fraction from your edge, take a fraction of it (half is the standard), then scale the whole thing by target_vol / current_vol. Your bet shrinks automatically when the market gets dangerous and expands when it calms down — without you touching a parameter.
The payoff is documented. Man Group's research shows volatility targeting reduces maximum drawdowns and makes left-tail events less severe across every asset class they tested (Man Group, 2018). The Kelly backtest above quantifies the same effect from a different angle: scaling risk down took the maximum drawdown from 48.4% to 25% (Carta & Conversano, 2020). That improvement comes almost entirely from holding smaller notional during the high-vol periods where left-tail losses cluster.
Adapting vol-targeting to binary contracts: Prediction-market payoffs are bounded between $0 and $1, so "volatility" isn't price diffusion — it's the speed at which the implied probability is moving. Use the standard deviation of recent implied-probability changes as your
current_volinput. A contract whose price is jumping 5 cents a minute is in a high-vol regime regardless of where it sits between 0 and 1. Scale your size down accordingly, and you've ported AQR's equity machinery to event markets.
Regime Detection: VIX-Style Signals for Prediction Markets
Volatility scaling is reactive — it shrinks your size after volatility rises. Regime detection is the early-warning layer on top: a signal that says "conditions are dangerous, cut harder than the vol number alone suggests."
In equities, that signal is the VIX. During 2025's "Liberation Day" tariff shock, the VIX peaked at 45.3 on April 4 — a 23.8-point single-event jump (CBOE, 2025). Crypto has its own versions: Deribit's DVOL and Volmex's BVIV track 30-day annualized Bitcoin implied volatility. The instructive part is how differently they behave. During the October 10 crash, the crypto BVIV index spiked from roughly 40% to 60% and stayed above 50%, while the equity VIX peaked near 29 and snapped back below 20 within days (CoinDesk, Oct 2025). Crypto volatility is sticky — and a bot trading crypto-correlated Kalshi contracts needs to assume the elevated regime persists.
You don't need a published index to build a regime detector. The cheapest version is a rolling realized-volatility z-score on the underlying: when current vol exceeds, say, two standard deviations above its trailing mean, flag a high-vol regime. More sophisticated approaches use Markov regime-switching or statistical jump models. A 2024 jump-model study improved annualized returns by 1-4% over buy-and-hold while reducing volatility and max drawdown out-of-sample across three decades of index data (Shu, Yu & Mulvey, 2024). A 2026 regime-aware framework held its max drawdown to −5.43% versus −14.62% for buy-and-hold, specifically by cutting exposure during the April 2025 stress regime (arXiv 2603.04441, 2026).
Automatic Capital Cuts During High-Volatility Periods
Detection without action is just a dashboard. The point of a regime signal is to trigger automatic capital cuts — rules that pull risk off the table before the cascade, not after your stop-loss already filled at a terrible price.
A practical high-vol playbook for a prediction-market bot:
- Scale notional by the vol ratio. This is the baseline:
target_vol / current_volshrinks every order automatically. It runs continuously, no regime flag required. - Hard cut on regime flag. When the realized-vol z-score crosses your threshold (or BVIV/DVOL spikes), cut total deployed capital by a fixed step — say, to 25% of normal — and keep it there until the signal clears. Crypto vol is sticky, so don't re-deploy on the first quiet hour.
- Widen your own quotes. If you're making markets, widen spreads to match the regime. The makers who survived October were the ones who pulled in or repriced before the book emptied.
- Cap correlated exposure. During a macro shock, "uncorrelated" Kalshi contracts suddenly move together. Treat crypto-, rate-, and election-correlated positions as one bucket and cap the bucket, not just the line items.
The reason these cuts work is the same volatility clustering that makes the problem dangerous: persistence of 0.9844 means the regime won't flip back the instant you'd like it to (NYU V-Lab, 2026). Cutting capital early and re-deploying slowly is mathematically aligned with how volatility actually decays.
In Turbine Studio, these cuts are configurable risk rules rather than code you maintain by hand. You set a volatility threshold and a capital-reduction step, and the bot enforces it without you watching the screen at 21:15 UTC. For the broader case on hands-off risk control, see automating prediction-market bots without constant monitoring.
How to Backtest for Volatility Regimes Specifically
A backtest that reports one Sharpe ratio across all conditions is hiding the only number that matters: how the strategy does when volatility spikes. Drawdowns concentrate in high-vol regimes, which is exactly why de-risking there cuts max drawdown by more than half (arXiv 2603.04441, 2026). If your backtest averages calm and crisis together, it launders the crisis performance into a number that looks survivable.
Backtest for regimes like this:
- Segment by volatility regime. Tag every historical period as low, medium, or high vol using a realized-vol or implied-vol cutoff. Compute Sharpe, win rate, and max drawdown separately for each regime. A strategy with a 2.0 Sharpe in calm and a −1.5 Sharpe in high vol is not a 1.0-Sharpe strategy — it's a bet that volatility stays low.
- Stress-test on tail events explicitly. Replay your strategy through the October 2025 cascade, the April 2025 tariff shock, and any election-night or Fed-day window in your data. If you don't have tick data through those events, you don't have a volatility backtest.
- Model the spread tax. Backtests using mid-quote prices systematically overstate fills. Apply a regime-dependent spread — widen it sharply in high-vol periods to approximate the 1,321x blowout (Amberdata, 2025).
- Test the vol-targeting overlay separately. Run the strategy with and without volatility scaling. If scaling doesn't improve your high-vol-regime drawdown, your sizing logic is broken — naive unconditional scaling can even backfire in some markets (Financial Analysts Journal, 2020).
Regime-conditioned backtesting in one line: Don't ask "what's my Sharpe?" Ask "what's my drawdown in the worst 5% of volatility days, and does my sizing logic shrink it?" For the full methodology on validating before you risk capital, see our guides to backtesting prediction-market strategies and paper trading before going live.
Build a Bot That Survives the Storm
A bot that only works in calm markets isn't a trading strategy — it's a countdown timer. The fix isn't a smarter signal; it's volatility-aware sizing, a regime detector, and automatic capital cuts that fire before the book empties. Turbine Studio lets you build all three as configurable rules on Kalshi prediction markets, then backtest them across the exact high-volatility windows that decide your annual P&L — no code required.
Frequently Asked Questions
Why do my trading bots keep failing during market volatility?
Because they're sized and tuned for calm conditions. In a volatility spike, liquidity disappears — BTC visible liquidity fell 99.8% in October 2025 — so fixed-size orders move prices far more than your backtest assumed, and mean-reversion logic fights a real regime change instead of noise (Amberdata, 2025).
What is volatility-adjusted position sizing?
It scales your position inversely to current volatility, so risk stays constant as conditions change. Estimate volatility from a trailing window, then multiply your bet by target_vol / current_vol. In a Kelly backtest, scaling risk this way cut maximum drawdown from 48.4% to 25% (Carta & Conversano, 2020).
Is there a VIX for prediction markets?
Not directly, but you can build one. Crypto has Deribit's DVOL and Volmex's BVIV for implied volatility, and for any contract you can compute a rolling realized-volatility z-score on the underlying. During the Oct 2025 crash, crypto's BVIV stayed above 50% long after the equity VIX reverted below 20 (CoinDesk, 2025).
Should I use full Kelly or half Kelly for a prediction-market bot?
Half Kelly, almost always. Full Kelly carries a 50% chance of a 50% drawdown; half Kelly cuts that to 12.5% while keeping about 75% of the growth (MacLean, Thorp & Ziemba, 2010). The growth you give up is small relative to the survival you buy.
How do I backtest specifically for volatility regimes?
Segment your backtest by volatility regime and report Sharpe, win rate, and drawdown separately for each. Replay the strategy through known tail events, apply a regime-dependent spread to model fill costs, and verify your sizing overlay actually shrinks high-vol drawdowns (arXiv 2603.04441, 2026).
The Bottom Line
- Calm and volatile are different markets. A bot optimized for quiet days is structurally designed to give back gains when volatility clusters arrive — and Bitcoin's 0.9844 GARCH persistence means they arrive in bunches.
- Liquidity evaporates faster than you can react. October 2025 saw BTC liquidity fall 99.8% and spreads widen 1,321x in 40 minutes. Prediction-market books are thinner; the same dynamic hits harder.
- Fixed-fraction sizing is fixed in dollars, exploding in risk. Volatility-adjusted Kelly keeps risk constant; half-Kelly buys an enormous drawdown reduction for a small growth haircut.
- Detect, then cut automatically. A realized-vol z-score or implied-vol index flags the regime; automatic capital cuts pull risk before the cascade, not after.
- Backtest by regime or don't bother. One blended Sharpe hides the only performance that matters. Segment by volatility, stress-test tail events, and model the spread tax.
This article is for educational purposes only and is not financial advice. Prediction-market and crypto trading involve substantial risk of loss, and volatility events can produce losses faster than any automated control can prevent. Past performance and backtested results do not guarantee future returns. Trade only what you can afford to lose.