Do Automated Trading Bots Actually Make Money on Prediction Markets? What the Data Shows
 Ryan Bajollari
We backtested 4,904 bot strategies on Kalshi's BTC markets. With fees and real fills priced in, only 102 made money. Here's what separated them.
Some do. Almost none.
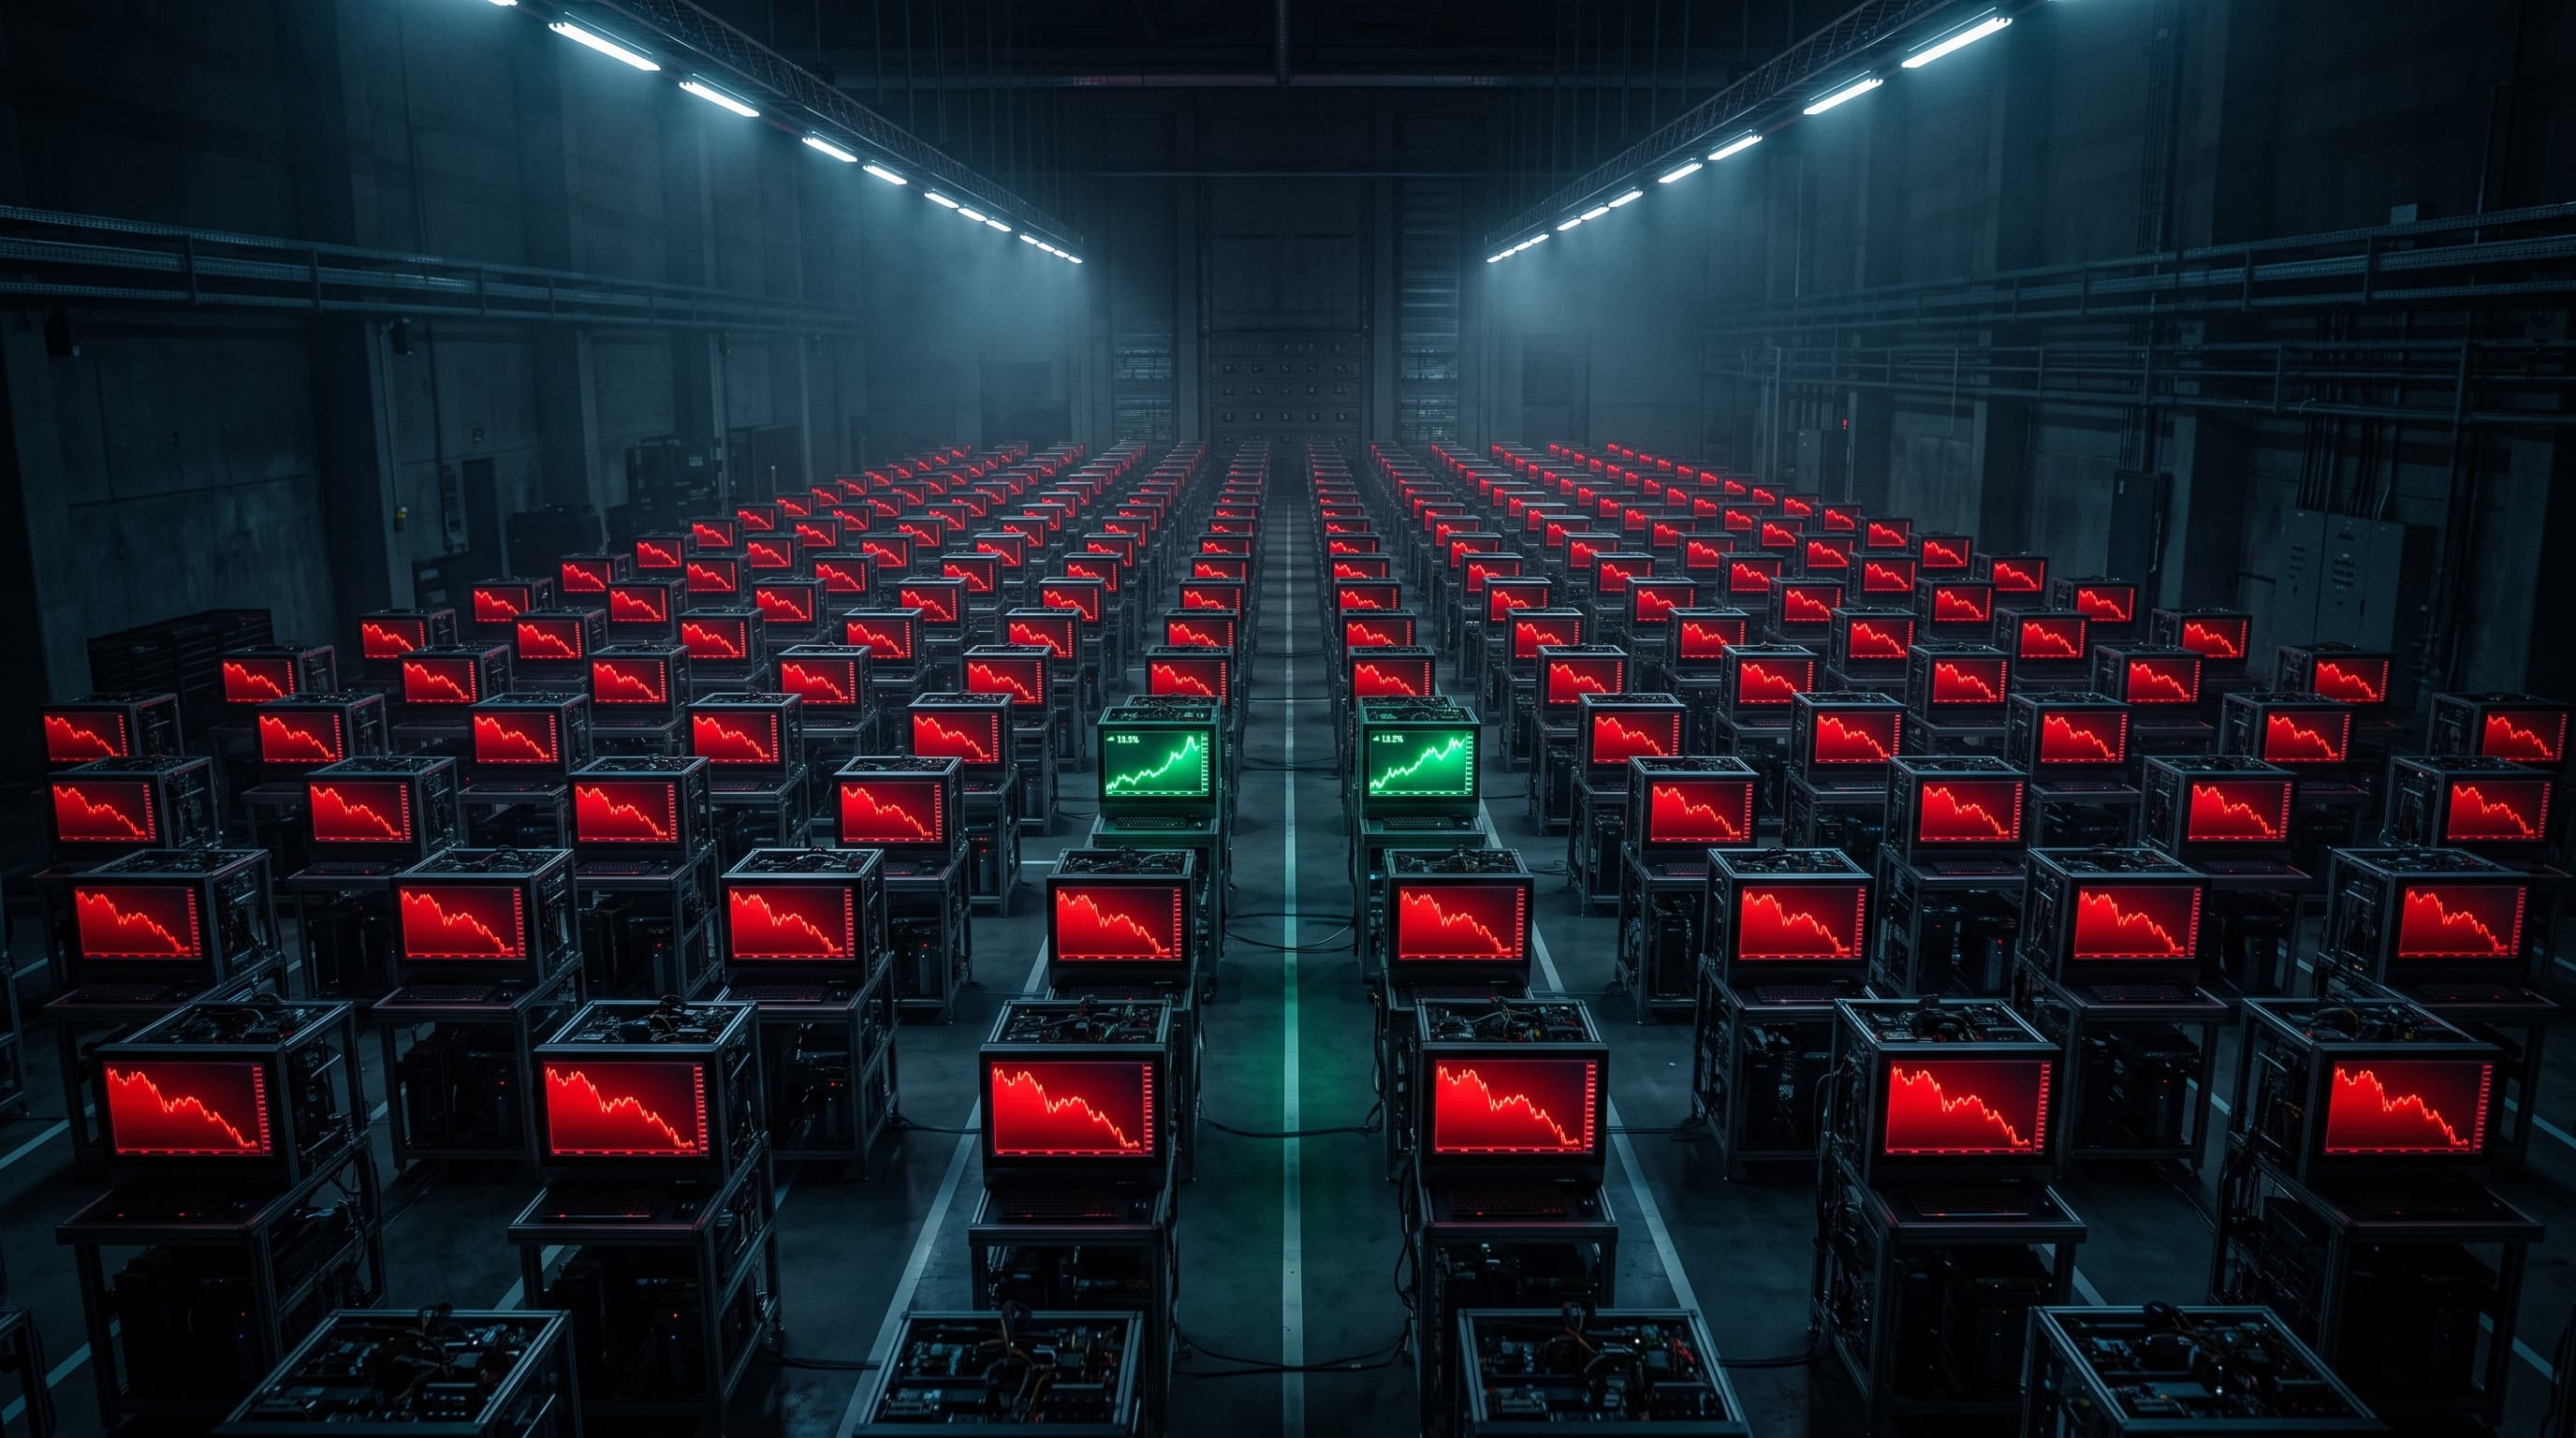
We know because we ran the test. Across 4,904 automated strategies on Kalshi's 15-minute BTC market, 102 finished profitable. The other 4,802 lost money. That's a 2.1% hit rate, and the median strategy returned −14.53%.
That's the honest answer for the strategies we could generate on one fast Kalshi series — not a universal verdict on every bot ever written. But the more useful finding isn't the 2.1%. It's what we had to change to get there.
Key Takeaways
- Only 102 of 4,904 Kalshi BTC strategies we backtested finished profitable — a 2.1% hit rate
- The same lab, on the same market, showed 69.5% profitable nine days earlier — most of that gap is the cost model, though the window moved too
- The 10 worst strategies won 62–63% of their trades and still lost 75–78%
- The archetype behind one run's best strategy was profitable in just 7 of 4,290 variants nine days later
- Per contract, Kalshi takers averaged −31.46% and makers −9.64%; only makers buying at 50¢+ were positive, at +2.6%
- Automation amplifies an edge. It does not create one
The Short Answer, With the Receipts
A small minority of bots make money, and the profitable slice is far smaller than most marketing suggests.
Start with our own numbers, because they're the cleanest first-hand evidence we have. In the run where we modeled fees, liquidity, and realistic fills most carefully — 4,904 strategies on Kalshi's 15-minute BTC series — 102 finished profitable, or 2.1%. A separate 500-strategy run on Kalshi's New York temperature market, using a lighter execution model, put 70 in the black, or 14%. We report those separately rather than pooling them, because they weren't tested to the same standard.
Real-money data points the same direction. A study of 588 million Polymarket trades and $67 billion in volume found that among users who finished with a positive P&L, the top 1% captured 76.5% of all profits (Akey, Grégoire, Harvie & Martineau, CEPR, 2026).
A Washington Post analysis of that same dataset put it in headcount terms. Roughly 1,200 people took more than half of all profits ever made on the platform, about $591 million (Washington Post, via Yahoo Finance, 2026).
Bloomberg's own analysis found that the 5% of wallets generating 75% of Polymarket's volume collectively made $131 million, while lower-volume accounts lost almost exactly the same amount (Bloomberg, via PYMNTS, 2026). More than 100,000 wallets lost at least $1,000 — nearly twice the number that gained that much.
One caveat on that reporting: Bloomberg describes the winning cohort as likely running automated strategies, and the Washington Post says their trades were probably automated. Neither outlet measured a bot share, and no credible public figure for "what percentage of prediction market volume is algorithmic" exists. Treat the bot attribution as an informed inference about very-high-frequency accounts, not a counted fact.
So a sliver of accounts takes most of the profit. The question this post is really about is what put them in that sliver — and whether automation is it.
What Happened When We Priced In Fees and Real Fills
Here's the finding that reframed how we read every backtest since.
In April 2026 we generated 1,000 strategies and ran them against 30 days of Kalshi's 15-minute BTC series. 695 of 1,000 finished profitable. Median ROI was +1.37%. The write-up is our 1,000-strategy backtest.
Nine days later we reran the experiment at five times the scale, on the same market series and the same engine. We changed three things in the execution model:
- Trading fees, charged per contract
- Order-book liquidity limits, so a strategy couldn't fill more than the book held
- Fills at the next candle's open, instead of the current candle
Profitability fell from 69.5% to 2.1%. The full results are in our 5,000-strategy backtest.
Be careful how you read that 67-point gap, because we were not careful enough at first. Three things differed between the two runs, not one: the cost model, the 30-day window (it rolled forward nine days), and the strategy population itself (1,000 strategies versus 4,904, with a different mix of archetypes). We can't cleanly separate those effects, so treat 67 points as an upper bound on what the cost model alone did.
What isn't ambiguous is the direction. A strategy targeting a 2¢ profit while ignoring a 1.75¢ per-contract fee isn't optimistic — it's mispriced by construction. As the section on edge decay below shows, the nine-day window shift mattered on its own.
What this means: most published "profitable bot" results are measuring the first version of that experiment. When someone shows you a backtest without fees, slippage, and a liquidity cap, they haven't shown you a strategy. They've shown you a spreadsheet. Ask which cost model produced the number before you ask how big the number is.
This is the single most common way a bot that "makes money" in testing loses money live. We wrote up the broader failure mode in why backtests lie.
You Can Win 62% of Your Trades and Still Lose 77%
The bottom of that 4,904-strategy leaderboard is more instructive than the top.
The 10 worst strategies were all tight-band price targets: buy at 58¢, sell at 60¢. Buy at 60¢, sell at 62¢. Each one fired more than 7,000 trades over 30 days. Each one won 62–63% of those trades. Each one still finished down 75–78%.
The arithmetic is unforgiving. A 2¢ profit target leaves nothing to absorb costs. Over the 2021–April 2025 sample in a University College Dublin working paper on Kalshi, the taker fee was 0.07 × P × (1−P) per contract, rounded up to the cent (Bürgi, Deng & Whelan, 2026).
Put numbers in it. On a 50¢ contract that's 1.75¢ per contract — against a 2¢ target. Cross the spread on the way in and again on the way out, and the fee alone is most of the prize before the market has moved at all.
Then the 37% of trades that lose don't lose 2¢. They lose whatever the book gives back. High win rate, negative expectancy, 7,000 times over.
The trap: win rate is the metric bot dashboards show most prominently, and it's the one least connected to profit. A strategy that wins 62% of the time and loses money is not a broken strategy. It's a correctly functioning strategy with a cost problem — which is much harder to notice, because everything on the screen looks like it's working.
Getting filled at bad prices is its own discipline. We covered the mechanics in why prediction market trades get picked off.
The Edge Decays Faster Than You Can Redeploy
Our first run produced a clear champion: buy YES at 50¢, sell at 70¢. It returned +56.6% and topped the 1,000-strategy leaderboard.
Nine days later, that same archetype — same series, same engine, 4,290 variants tested — was profitable in 7 of them. A 0.16% hit rate. Mean return −19.95%. Worst variant −77.73%.
That last line is the part that matters for automation specifically. A human trading that rule by hand would have noticed the losses piling up. A bot executes the rule exactly as written, at 3 a.m., every fifteen minutes, until someone turns it off.
Automation removes the emotional mistakes. It also removes the person who would have said "this stopped working."
It Wasn't a Crypto Problem
The obvious objection: 15-minute BTC markets are unusually hard. Fast, noisy, thin.
So we ran a completely different test. 500 strategies, ten families, against Kalshi's New York high-temperature market — a slow, daily, fundamentals-driven contract about as far from 15-minute crypto as Kalshi offers.
70 of 500 finished profitable. The median strategy returned −41.61%. The best one returned +117.75%, and it was the least clever idea in the set: buy YES when the forecast says hot and the price is still cheap. Details are in our 500-strategy weather backtest.
Different market, different time scale, different data source, same shape: a thin band of winners and a wide field of losers.
One caveat we owe you. That weather run used the LaGuardia observation feed. We later confirmed against Kalshi's live series metadata that
KXHIGHNYsettles on Central Park, not LaGuardia. The two stations disagree often enough to matter, so treat the weather numbers above as directional, not exact. We're flagging it because it's a perfect illustration of the post's own argument: a bot built on that feed would have executed flawlessly against slightly wrong ground truth, and the backtest would never have told us.
The Outside Data Points the Same Direction
Our lab results describe simulated strategies. The published research on real traders is, if anything, harsher.
A University College Dublin study of Kalshi found the average contract returns about −20% before fees (Bürgi, Deng & Whelan, 2026). That's the baseline a bot starts from. Automating a trade that loses 20% on average gets you to that loss faster and more reliably.
Accuracy doesn't rescue it either. In the Prophet Arena benchmark across 1,367 Kalshi events, the best AI model roughly matched the market's forecasting accuracy — a Brier score of 0.184 against the market's 0.187 — and the best average return any model posted was 0.943 against a 1.0 breakeven (Prophet Arena, arXiv, 2025). Forecasting as well as the market is not an edge. It's a tie, and a tie loses to fees.
And this isn't a prediction-market quirk. Of Brazilian day traders who persisted more than 300 days, 97% lost money, and only 0.4% earned more than a bank teller (Chague, De-Losso & Giovannetti, 2019). In Taiwan's entire market over 15 years, less than 1% of day traders reliably earned positive returns net of fees (Barber, Lee, Liu & Odean, 2014).
The pattern across all of it: every dataset here separates being right from making money. The 62%-win-rate strategies were right. The AI models were accurate. The longshot buyers were occasionally correct. All of them lost, because the price they paid for being right exceeded what being right was worth.
The One Finding That Explains the Rest
If you read only one statistic in this post, make it this one.
The same Kalshi study split every trade by whether the trader provided liquidity with a resting limit order (a maker) or took it by crossing the spread (a taker). Across roughly 157,000 contracts on each side:
| Group | Average return per contract |
|---|---|
| Takers (cross the spread) | −31.46% |
| All contracts, before fees | −20% |
| Makers (rest a limit order) | −9.64% |
| Makers buying at 50¢ and up | +2.6% |
Two things to hold onto before you build anything on that last row.
It's a subgroup, and I've just spent a section telling you to distrust subgroups. The +2.6% is one cut (maker × price ≥ 50¢) from a paper that reports several. It deserves the same skepticism I'm asking you to apply to our own leaderboard.
The fee regime it describes is gone. During the paper's sample, Kalshi charged takers but not makers — the authors ended their sample at April 2025 precisely because Kalshi started charging makers after that. So these maker returns describe a world where resting a quote was free. That tailwind no longer exists, and any maker edge today has to clear a fee the study's makers never paid.
The Polymarket research found the same split independently: the users who won were the ones providing liquidity with limit orders, while the losers were taking it with market orders (Akey et al., CEPR, 2026). Two different venues, two different research teams, same answer.
This is what "amplifies an edge" actually means. The profitable niche here is narrow and structural: rest limit orders, on contracts priced 50¢ and up, and wait. That edge existed before anyone wrote a bot. What a bot adds is the ability to hold hundreds of resting quotes across dozens of markets at 4 a.m. without getting impatient and crossing the spread. The automation scales the edge. It doesn't supply it.
It also explains our own results. The panic-fade strategies that won our BTC run were supplying liquidity exactly when the book was demanding it. The 2¢-band strategies that lost 77% were crossing the spread thousands of times to capture two cents.
Why You Should Distrust Our Numbers Too
There's an uncomfortable corollary to running 4,904 backtests.
If you try enough strategy configurations, some will look brilliant by chance. The canonical work on this shows that testing just 10 configurations is expected to produce an in-sample Sharpe ratio of 1.57 even when the true out-of-sample Sharpe is exactly zero (Bailey, Borwein, López de Prado & Zhu, Notices of the AMS, 2014). The same paper gives a rule of thumb: with five years of data, try more than 45 independent configurations and you're nearly guaranteed to manufacture a strategy with an in-sample Sharpe of 1 and an expected out-of-sample Sharpe of zero.
We tested 4,904 configurations on 30 days of data.
So read our leaderboard accordingly. The top strategy in a 4,904-strategy sweep is not evidence that the strategy works — it's the expected output of a large search. That's why the finding we trust most from those runs isn't the +18.32% winner. It's the shape: 93 of 96 panic-fade variants profitable, and 0 of 432 mean-reversion variants profitable. A result that holds across every parameterization of an idea is hard to explain as luck. A single winner is not.
Note which number this does and doesn't threaten. Selection bias inflates the maximum of a large search, not its failure rate. Testing 4,904 strategies makes our +18.32% winner suspect. It makes the 2.1% headline more trustworthy, not less — searching harder can only find more winners, so a 2.1% hit rate after an exhaustive sweep is close to a floor.
This is exactly why parameter sweeps need permutation testing rather than a leaderboard. We covered the method in parameter sweeps and permutation testing.
So What Separated the 2%?

Looking at what actually worked across all three runs, the winners shared three things. None of them was the automation.
A structural reason to exist. The dominant winner on 15-minute BTC was panic-fade: when the book moves hard inside a 15-minute window, take the other side. 93 of 96 variants were profitable. That's harder to dismiss as curve-fitting, since it isn't one lucky parameter but the whole family — though it's still one series in one 30-day window. Compare mean-reversion on the same market: 0 for 432. Not one variant made money, because a 15-minute contract doesn't leave time for a price to drift away and come back.
A cost model built in from the start. The winners cleared enough per trade to survive fees and spread. The losers targeted 2¢ and died on arithmetic.
Size discipline. In the top 10, every strategy used the same size parameter. The threshold barely mattered; the sizing did.
Notice what's absent from that list. Speed. Complexity. Machine learning. The winning weather strategy was three conditions in plain English.
The conclusion the data forces: a bot is an amplifier. Feed it a real edge and it will harvest that edge around the clock without getting bored, scared, or distracted — which is genuinely valuable. Feed it a plausible-sounding idea and it will execute that idea into the ground with perfect discipline. The automation multiplies whatever you give it. It has no opinion about the sign.
If you want the full picture of how these systems are built and where they break, start with our overview of automated trading bots for prediction markets. For the strategy side specifically, five strategy archetypes breaks down the assumption behind each family and how each one fails.
How to Find Out Whether You Have an Edge
The practical takeaway isn't "don't run bots." It's "find out which kind you have before it's expensive."
- Backtest with fees, liquidity caps, and next-bar fills. If your results move as much as ours did when you turn those on, the strategy was never there. How to backtest prediction market strategies walks through the setup.
- Sweep the parameters, don't pick the winner. A single great result in a sweep is usually noise, as the Bailey numbers above show. Trust an idea only when most of its parameterizations work, and permutation-test before you believe a leaderboard.
- Paper trade the plumbing. It won't validate your edge, but it catches the failures that kill live bots. Here's what paper trading can and can't prove.
- Go live small, and re-check monthly. Our champion decayed in nine days. Assume yours will too.
If you're weighing bots against trading by hand, our guide to making money on prediction markets covers the non-automated approaches.
Test Your Strategy Before You Fund It
The expensive way to learn all of this is to deploy a bot and watch the 2¢ targets bleed out over a few thousand trades. The cheap way is to run the backtest with honest assumptions first.
Turbine Studio lets you describe a strategy in plain English and backtest it against historical Kalshi and Polymarket order-book data, with fees and liquidity modeled in. All 6,404 strategies across the three runs in this post were tested on that same engine.
Frequently Asked Questions
Do automated trading bots actually make money on prediction markets?
A small minority do. In our 4,904-strategy Kalshi BTC backtest, 102 finished profitable — a 2.1% hit rate with a median return of −14.53%. Real-money data is similar: among Polymarket users with positive P&L, the top 1% captured 76.5% of all profits. Bots amplify an existing edge rather than creating one.
Why do most prediction market bots lose money?
Costs, mostly. Fees and spread are charged on every trade, and high-frequency strategies with small profit targets can't clear them. Our 10 worst strategies won 62–63% of more than 7,000 trades each and still lost 75–78%, because each win cleared about 2¢ while fees and slippage took more.
Can a backtest tell me if my bot will be profitable?
Only if it models costs honestly. Our own results swung from 69.5% profitable to 2.1% on the same market and engine after we added fees, liquidity limits, and next-candle fills — though the window and strategy set changed too, so that gap is an upper bound. A backtest without those three things measures a strategy that can't be traded.
How long does a profitable prediction market strategy last?
Often not long. Our best strategy returned +56.6% in one 30-day window, then was profitable in only 7 of 4,290 variants nine days later — a 0.16% hit rate with a mean return of −19.95%. Re-validate on fresh data regularly instead of trusting a deployed strategy indefinitely.
Is a bot better than trading prediction markets manually?
It depends entirely on whether your rule has an edge. Bots beat people on coverage, speed, and consistency, and they don't revenge-trade. They also execute a losing rule with perfect discipline forever. Automation is a multiplier on the sign of your expected value.
The Takeaways
The evidence is in the sections above. Here's what to do with it.
- Ask which cost model produced any bot result you're shown, including ours. Fees, liquidity caps, and next-bar fills are the difference between a strategy and a spreadsheet.
- Stop optimizing win rate. It's the metric dashboards show and the one least tied to profit. Track expectancy per trade net of fees instead.
- Trust families, not winners. One great parameter combination in a sweep is the expected output of searching. An idea that works across most of its parameterizations is a finding.
- Re-validate on a cadence, not on a feeling. Our champion decayed in nine days. Put a date on the calendar to re-run, and honor it.
- Decide whether you're a maker or a taker before you write code. That single choice separated −9.64% from −31.46% per contract in the Kalshi data, and it's a design decision, not a tuning parameter.
- Find your edge first, then automate it. Every winning group in every dataset here had a structural reason to work. The automation scaled the result. It never supplied it.
When you're ready to test a rule properly, start with our overview of automated trading bots for prediction markets.
This article is for informational and educational purposes only. It is not investment, legal, or tax advice, and nothing here recommends trading any specific contract or strategy. Turbine is not a registered investment adviser, broker-dealer, commodity trading advisor, or commodity pool operator.
The Turbine results described here are backtests: simulations against historical order-book data over specific windows on single market series (Kalshi KXBTC15M, 30 days ending 2026-04-20 and 2026-04-29; Kalshi New York high-temperature markets, May 2026). Hypothetical and simulated performance has inherent limitations — it is prepared with hindsight, risks no real capital, and cannot fully account for execution, liquidity, fees, or changing conditions. The weather run used LaGuardia observations, while the contract settles on Central Park; those figures are directional. ROI figures are normalized on a $10,000 notional. Past performance, actual or hypothetical, does not indicate future results. Prediction market trading involves substantial risk, including loss of the entire amount invested. Venue fees, rules, and incentive programs change; verify current terms before trading.